LensCrafters 2012 Annual Report Download - page 256
Download and view the complete annual report
Please find page 256 of the 2012 LensCrafters annual report below. You can navigate through the pages in the report by either clicking on the pages listed below, or by using the keyword search tool below to find specific information within the annual report.-
 1
1 -
2
-
3
-
4
-
5
-
6
-
7
-
8
-
9
-
10
-
11
-
12
-
13
-
14
-
15
-
16
-
17
-
18
-
19
-
20
-
21
-
22
-
23
-
24
-
25
-
26
-
27
-
28
-
29
-
30
-
31
-
32
-
33
-
34
-
35
-
36
-
37
-
38
-
39
-
40
-
41
-
42
-
43
-
44
-
45
-
46
-
47
-
48
-
49
-
50
-
51
-
52
-
53
-
54
-
55
-
56
-
57
-
58
-
59
-
60
-
61
-
62
-
63
-
64
-
65
-
66
-
67
-
68
-
69
-
70
-
71
-
72
-
73
-
74
-
75
-
76
-
77
-
78
-
79
-
80
-
81
-
82
-
83
-
84
-
85
-
86
-
87
-
88
-
89
-
90
-
91
-
92
-
93
-
94
-
95
-
96
-
97
-
98
-
99
-
100
-
101
-
102
-
103
-
104
-
105
-
106
-
107
-
108
-
109
-
110
-
111
-
112
-
113
-
114
-
115
-
116
-
117
-
118
-
119
-
120
-
121
-
122
-
123
-
124
-
125
-
126
-
127
-
128
-
129
-
130
-
131
-
132
-
133
-
134
-
135
-
136
-
137
-
138
-
139
-
140
-
141
-
142
-
143
-
144
-
145
-
146
-
147
-
148
-
149
-
150
-
151
-
152
-
153
-
154
-
155
-
156
-
157
-
158
-
159
-
160
-
161
-
162
-
163
-
164
-
165
-
166
-
167
-
168
-
169
-
170
-
171
-
172
-
173
-
174
-
175
-
176
-
177
-
178
-
179
-
180
-
181
-
182
-
183
-
184
-
185
-
186
-
187
-
188
-
189
-
190
-
191
-
192
-
193
-
194
-
195
-
196
-
197
-
198
-
199
-
200
-
201
-
202
-
203
-
204
-
205
-
206
-
207
-
208
-
209
-
210
-
211
-
212
-
213
-
214
-
215
-
216
-
217
-
218
-
219
-
220
-
221
-
222
-
223
-
224
-
225
-
226
-
227
-
228
-
229
-
230
-
231
-
232
-
233
-
234
-
235
-
236
-
237
-
238
-
239
-
240
-
241
-
242
-
243
-
244
-
245
-
 246
246 -
 247
247 -
 248
248 -
 249
249 -
 250
250 -
 251
251 -
 252
252 -
 253
253 -
 254
254 -
 255
255 -
 256
256 -
 257
257 -
 258
258 -
 259
259 -
 260
260 -
 261
261 -
 262
262 -
 263
263 -
 264
264 -
 265
265 -
 266
266 -
267
-
268
-
269
-
270
-
271
-
272
-
273
-
274
-
275
-
276
-
277
-
278
-
279
 |
 |

ANNUAL REPORT 2012> 170 |
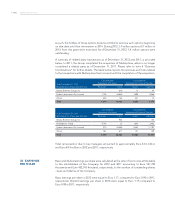
as such, the holders of these options became entitled to exercise such options beginning
on that date until their termination in 2014. During 2012, 3.9 million options (0.7 million in
2011) from this grant were exercised. As of December 31, 2012, 3.4 million options were
outstanding.
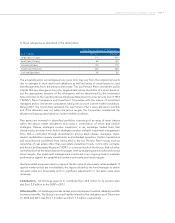
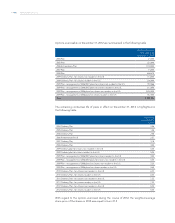
A summary of related party transactions as of December 31, 2012 and 2011, is provided
below. In 2011, the Group completed the acquisition of Multiopticas, which is no longer
considered a related party as of December 31, 2011. Please refer to note 4 “Business
Combinations” for further details. The table below reports the revenues and costs related
to the transactions with Multiopticas that occurred until the completion of the acquisition.
As of December 31, 2012
Related parties (thousands of Euro)
Consolidated
Statement of Income
Consolidated
Statement of Financial Position
Revenues Costs Assets Liabilities
Brooks Brothers Group, Inc. - 802 13 40
Eyebiz Laboratories Pty Limited 1,194 44,862 7,898 9,086
Others 650 764 447 72
Total 1,844 46,428 8,358 9,198
As of December 31, 2011
Related parties (thousands of Euro)
Consolidated
Statement of Income
Consolidated
Statement of Financial Position
Revenues Costs Assets Liabilities
Brooks Brothers Group, Inc. - 984 - 155
Multiopticas Group 4,743 25 1,600 2,465
Eyebiz Laboratories Pty Limited 970 44,584 8,553 17,793
Others 581 871 727 159
Total 6,294 46,464 10,880 20,572
Total remuneration due to key managers amounted to approximately Euro43.2 million
and Euro48.9 million in 2012 and 2011, respectively.
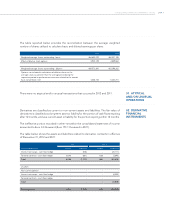
Basic and diluted earnings per share were calculated as the ratio of net income attributable
to the stockholders of the Company for 2012 and 2011 amounting to Euro 541,700
thousands and Euro452,343 thousand, respectively, to the number of outstanding shares
- basic and dilutive of the Company.
Basic earnings per share in 2012 were equal to Euro1.17, compared to Euro0.98 in 2011,
respectively. Diluted earnings per share in 2012 were equal to Euro 1.15 compared to
Euro0.98 in 2011, respectively.
30. EARNINGS
PER SHARE