LensCrafters 2012 Annual Report Download - page 246
Download and view the complete annual report
Please find page 246 of the 2012 LensCrafters annual report below. You can navigate through the pages in the report by either clicking on the pages listed below, or by using the keyword search tool below to find specific information within the annual report.-
 1
1 -
2
-
3
-
4
-
5
-
6
-
7
-
8
-
9
-
10
-
11
-
12
-
13
-
14
-
15
-
16
-
17
-
18
-
19
-
20
-
21
-
22
-
23
-
24
-
25
-
26
-
27
-
28
-
29
-
30
-
31
-
32
-
33
-
34
-
35
-
36
-
37
-
38
-
39
-
40
-
41
-
42
-
43
-
44
-
45
-
46
-
47
-
48
-
49
-
50
-
51
-
52
-
53
-
54
-
55
-
56
-
57
-
58
-
59
-
60
-
61
-
62
-
63
-
64
-
65
-
66
-
67
-
68
-
69
-
70
-
71
-
72
-
73
-
74
-
75
-
76
-
77
-
78
-
79
-
80
-
81
-
82
-
83
-
84
-
85
-
86
-
87
-
88
-
89
-
90
-
91
-
92
-
93
-
94
-
95
-
96
-
97
-
98
-
99
-
100
-
101
-
102
-
103
-
104
-
105
-
106
-
107
-
108
-
109
-
110
-
111
-
112
-
113
-
114
-
115
-
116
-
117
-
118
-
119
-
120
-
121
-
122
-
123
-
124
-
125
-
126
-
127
-
128
-
129
-
130
-
131
-
132
-
133
-
134
-
135
-
136
-
137
-
138
-
139
-
140
-
141
-
142
-
143
-
144
-
145
-
146
-
147
-
148
-
149
-
150
-
151
-
152
-
153
-
154
-
155
-
156
-
157
-
158
-
159
-
160
-
161
-
162
-
163
-
164
-
165
-
166
-
167
-
168
-
169
-
170
-
171
-
172
-
173
-
174
-
175
-
176
-
177
-
178
-
179
-
180
-
181
-
182
-
183
-
184
-
185
-
186
-
187
-
188
-
189
-
190
-
191
-
192
-
193
-
194
-
195
-
196
-
197
-
198
-
199
-
200
-
201
-
202
-
203
-
204
-
205
-
206
-
207
-
208
-
209
-
210
-
211
-
212
-
213
-
214
-
215
-
216
-
217
-
218
-
219
-
220
-
221
-
222
-
223
-
224
-
225
-
226
-
227
-
228
-
229
-
230
-
231
-
232
-
233
-
234
-
235
-
 236
236 -
 237
237 -
 238
238 -
 239
239 -
 240
240 -
 241
241 -
 242
242 -
 243
243 -
 244
244 -
 245
245 -
 246
246 -
 247
247 -
 248
248 -
 249
249 -
 250
250 -
 251
251 -
 252
252 -
 253
253 -
 254
254 -
 255
255 -
 256
256 -
257
-
258
-
259
-
260
-
261
-
262
-
263
-
264
-
265
-
266
-
267
-
268
-
269
-
270
-
271
-
272
-
273
-
274
-
275
-
276
-
277
-
278
-
279
 |
 |

ANNUAL REPORT 2012> 160 |
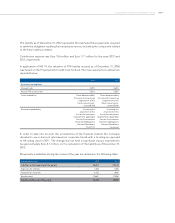
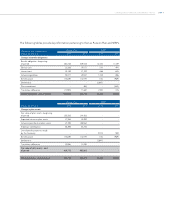
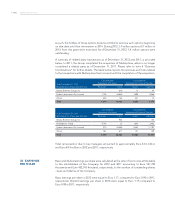
Defined benefit plan data for the current and previous four annual periods are as
follows:
(thousands of Euro) 2012 2011 2010 2009 2008
Pension Plans:
Defined benefit obligation 557,565 483,738 409,316 334,015 313,520
Fair value of plan assets 429,775 355,563 314,501 238,168 184,379
Plan surplus/(deficit) (127,790) (128,175) (94,815) (95,847) (129,141)
Plan liabilities experience gain/(loss) 6,020 (1,287) 1,744 (1,761) (4,379)
Plan assets experience gain/(loss) 21,594 (28,762) 14,462 23,790 (73,341)
SERPs:
Defined benefit obligation 10,388 12,344 11,340 11,299 12,015
Fair value of plan assets - - - - -
Plan surplus/(deficit) (10,388) (12,344) (11,340) (11,299) (12,015)
Plan liabilities experience gain/(loss) (578) (608) 421 1,228 (927)
The Group’s discount rate is developed using a third party yield curve derived from
non-callable bonds of at least an Aa rating by Moody’s Investor Services or at least an
AA rating by Standard & Poor’s. Each bond issue is required to have at least USD250
million par outstanding. The yield curve compares the future expected benefit
payments of the Lux Pension Plan to these bond yields to determine an equivalent
discount rate.
The Group uses an assumption for salary increases based on a graduated approach of
historical experience. The Group’s experience shows salary increases that typically vary
by age.
In developing the long-term rate of return assumption, the Group considers its asset
allocation. The Group analyzed historical rates of return being earned for each asset
category over various periods of time. Additionally, the Group considered input from
its third party pension asset managers, investment consultants and plan actuaries,
including their review of asset class return expectations and long-term inflation
assumptions.
Plan Assets - The Lux Pension Plan’s investment policy is to invest plan assets in a manner
to ensure over a long-term investment horizon that the plan is adequately funded;
maximize investment return within reasonable and prudent levels of risk; and maintain
sufficient liquidity to make timely benefit and administrative expense payments. This
investment policy was developed to provide the framework within which the fiduciary’s
investment decisions are made, establish standards to measure the investment manager’s
and investment consultant’s performance, outline the roles and responsibilities of the
various parties involved, and describe the ongoing review process. The investment
policy identifies target asset allocations for the plan’s assets at 40 percent Large Cap
U.S. Equity, 10 percent Small Cap U.S. Equity, 15 percent International Equity, and 35
percent Fixed Income Securities, but an allowance is provided for a range of allocations