LensCrafters 2012 Annual Report Download - page 95
Download and view the complete annual report
Please find page 95 of the 2012 LensCrafters annual report below. You can navigate through the pages in the report by either clicking on the pages listed below, or by using the keyword search tool below to find specific information within the annual report.-
 1
1 -
2
-
3
-
4
-
5
-
6
-
7
-
8
-
9
-
10
-
11
-
12
-
13
-
14
-
15
-
16
-
17
-
18
-
19
-
20
-
21
-
22
-
23
-
24
-
25
-
26
-
27
-
28
-
29
-
30
-
31
-
32
-
33
-
34
-
35
-
36
-
37
-
38
-
39
-
40
-
41
-
42
-
43
-
44
-
45
-
46
-
47
-
48
-
49
-
50
-
51
-
52
-
53
-
54
-
55
-
56
-
57
-
58
-
59
-
60
-
61
-
62
-
63
-
64
-
65
-
66
-
67
-
68
-
69
-
70
-
71
-
72
-
73
-
74
-
75
-
76
-
77
-
78
-
79
-
80
-
81
-
82
-
83
-
84
-
 85
85 -
 86
86 -
 87
87 -
 88
88 -
 89
89 -
 90
90 -
 91
91 -
 92
92 -
 93
93 -
 94
94 -
 95
95 -
 96
96 -
 97
97 -
 98
98 -
 99
99 -
 100
100 -
 101
101 -
 102
102 -
 103
103 -
 104
104 -
 105
105 -
106
-
107
-
108
-
109
-
110
-
111
-
112
-
113
-
114
-
115
-
116
-
117
-
118
-
119
-
120
-
121
-
122
-
123
-
124
-
125
-
126
-
127
-
128
-
129
-
130
-
131
-
132
-
133
-
134
-
135
-
136
-
137
-
138
-
139
-
140
-
141
-
142
-
143
-
144
-
145
-
146
-
147
-
148
-
149
-
150
-
151
-
152
-
153
-
154
-
155
-
156
-
157
-
158
-
159
-
160
-
161
-
162
-
163
-
164
-
165
-
166
-
167
-
168
-
169
-
170
-
171
-
172
-
173
-
174
-
175
-
176
-
177
-
178
-
179
-
180
-
181
-
182
-
183
-
184
-
185
-
186
-
187
-
188
-
189
-
190
-
191
-
192
-
193
-
194
-
195
-
196
-
197
-
198
-
199
-
200
-
201
-
202
-
203
-
204
-
205
-
206
-
207
-
208
-
209
-
210
-
211
-
212
-
213
-
214
-
215
-
216
-
217
-
218
-
219
-
220
-
221
-
222
-
223
-
224
-
225
-
226
-
227
-
228
-
229
-
230
-
231
-
232
-
233
-
234
-
235
-
236
-
237
-
238
-
239
-
240
-
241
-
242
-
243
-
244
-
245
-
246
-
247
-
248
-
249
-
250
-
251
-
252
-
253
-
254
-
255
-
256
-
257
-
258
-
259
-
260
-
261
-
262
-
263
-
264
-
265
-
266
-
267
-
268
-
269
-
270
-
271
-
272
-
273
-
274
-
275
-
276
-
277
-
278
-
279
 |
 |

| 9 >MANAGEMENT REPORT
As a result of our numerous acquisitions and the subsequent expansion of our business
activities in the United States through these acquisitions, our results of operations, which
are reported in Euro, are susceptible to currency rate fluctuations between the Euro and
the USD. The Euro/USD exchange rate has fluctuated from an average exchange rate of
Euro1.00 = USD 1.2848 in 2012 to Euro1.00 = USD 1.3920 in 2011. Our results of operations
have also been rendered susceptible to currency fluctuations between the Euro and the
Australian Dollar, due to the significant business volumes in our Australian retail operations.
Additionally, we incur part of our manufacturing costs in Chinese Yuan; therefore, the
fluctuation of the Chinese Yuan relative to other currencies in which we receive revenues could
impact the demand of our products or the profitability in consolidation. Although we engage
in certain foreign currency hedging activities to mitigate the impact of these fluctuations, they
have impacted our reported revenues and expenses during the periods discussed herein.
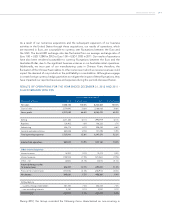
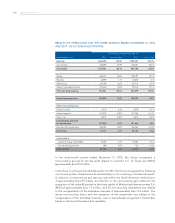
RESULTS OF OPERATIONS FOR THE YEAR ENDED DECEMBER 31, 2012 AND 2011 -
IN ACCORDANCE WITH IFRS
Years ended December 31,
(thousands of Euro) 2012 % of net sales 2011 % of net sales
Net sales 7,086,142 100.0% 6,222,483 100.0%
Cost of sales 2,379,093 33.6% 2,168,065 34.8%
Gross profit 4,707,049 66.4% 4,054,419 65.2%
Selling 2,271,383 32.1% 1,994,979 32.1%
Royalties 124,403 1.8% 106,322 1.7%
Advertising 446,175 6.3% 408,483 6.6%
General and administrative 883,038 12.5% 737,495 11.9%
Total operating expenses 3,725,000 52.6% 3,247,278 52.2%
Income from operations 982,049 13.9% 807,140 13.0%
Other income/(expense)
Interest income 18,910 0.3% 12,472 0.2%
Interest expense (138,140) (1.9%) (121,067) (1.9%)
Other - net (6,463) (0.1%) (3,273) (0.1%)
Income before provision
for income taxes 856,357 12.1% 695,272 11.2%
Provision for income taxes (310,476) (4.4%) (236,972) (3.8%)
Net income 545,881 7.7% 458,300 7.4%
Attributable to:
- Luxottica Group stockholders 541,700 7.6% 452,343 7.3%
- non-controlling interests 4,181 0.1% 5,957 0.1%
NET INCOME 545,881 7.7% 458,300 7.4%
During 2012, the Group recorded the following items characterized as non-recurring in