LensCrafters 2012 Annual Report Download - page 231
Download and view the complete annual report
Please find page 231 of the 2012 LensCrafters annual report below. You can navigate through the pages in the report by either clicking on the pages listed below, or by using the keyword search tool below to find specific information within the annual report.-
 1
1 -
2
-
3
-
4
-
5
-
6
-
7
-
8
-
9
-
10
-
11
-
12
-
13
-
14
-
15
-
16
-
17
-
18
-
19
-
20
-
21
-
22
-
23
-
24
-
25
-
26
-
27
-
28
-
29
-
30
-
31
-
32
-
33
-
34
-
35
-
36
-
37
-
38
-
39
-
40
-
41
-
42
-
43
-
44
-
45
-
46
-
47
-
48
-
49
-
50
-
51
-
52
-
53
-
54
-
55
-
56
-
57
-
58
-
59
-
60
-
61
-
62
-
63
-
64
-
65
-
66
-
67
-
68
-
69
-
70
-
71
-
72
-
73
-
74
-
75
-
76
-
77
-
78
-
79
-
80
-
81
-
82
-
83
-
84
-
85
-
86
-
87
-
88
-
89
-
90
-
91
-
92
-
93
-
94
-
95
-
96
-
97
-
98
-
99
-
100
-
101
-
102
-
103
-
104
-
105
-
106
-
107
-
108
-
109
-
110
-
111
-
112
-
113
-
114
-
115
-
116
-
117
-
118
-
119
-
120
-
121
-
122
-
123
-
124
-
125
-
126
-
127
-
128
-
129
-
130
-
131
-
132
-
133
-
134
-
135
-
136
-
137
-
138
-
139
-
140
-
141
-
142
-
143
-
144
-
145
-
146
-
147
-
148
-
149
-
150
-
151
-
152
-
153
-
154
-
155
-
156
-
157
-
158
-
159
-
160
-
161
-
162
-
163
-
164
-
165
-
166
-
167
-
168
-
169
-
170
-
171
-
172
-
173
-
174
-
175
-
176
-
177
-
178
-
179
-
180
-
181
-
182
-
183
-
184
-
185
-
186
-
187
-
188
-
189
-
190
-
191
-
192
-
193
-
194
-
195
-
196
-
197
-
198
-
199
-
200
-
201
-
202
-
203
-
204
-
205
-
206
-
207
-
208
-
209
-
210
-
211
-
212
-
213
-
214
-
215
-
216
-
217
-
218
-
219
-
220
-
 221
221 -
 222
222 -
 223
223 -
 224
224 -
 225
225 -
 226
226 -
 227
227 -
 228
228 -
 229
229 -
 230
230 -
 231
231 -
 232
232 -
 233
233 -
 234
234 -
 235
235 -
 236
236 -
 237
237 -
 238
238 -
 239
239 -
 240
240 -
 241
241 -
242
-
243
-
244
-
245
-
246
-
247
-
248
-
249
-
250
-
251
-
252
-
253
-
254
-
255
-
256
-
257
-
258
-
259
-
260
-
261
-
262
-
263
-
264
-
265
-
266
-
267
-
268
-
269
-
270
-
271
-
272
-
273
-
274
-
275
-
276
-
277
-
278
-
279
 |
 |
| 145 >CONSOLIDATED FINANCIAL STATEMENTS - NOTES
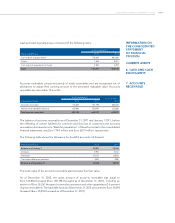
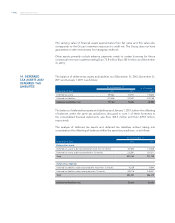
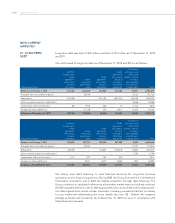
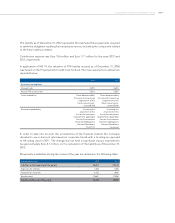
The gross movement in the deferred income tax accounts is as follows:
As of January 1, 2012 78,636
Exchange rate difference and other movements 16,932
Business combinations 4,898
Income statements (28,910)
Tax charge/(credit) directly to equity (13,412)
At December 31, 2012 58,144
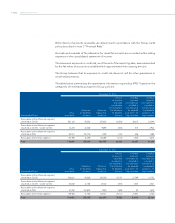
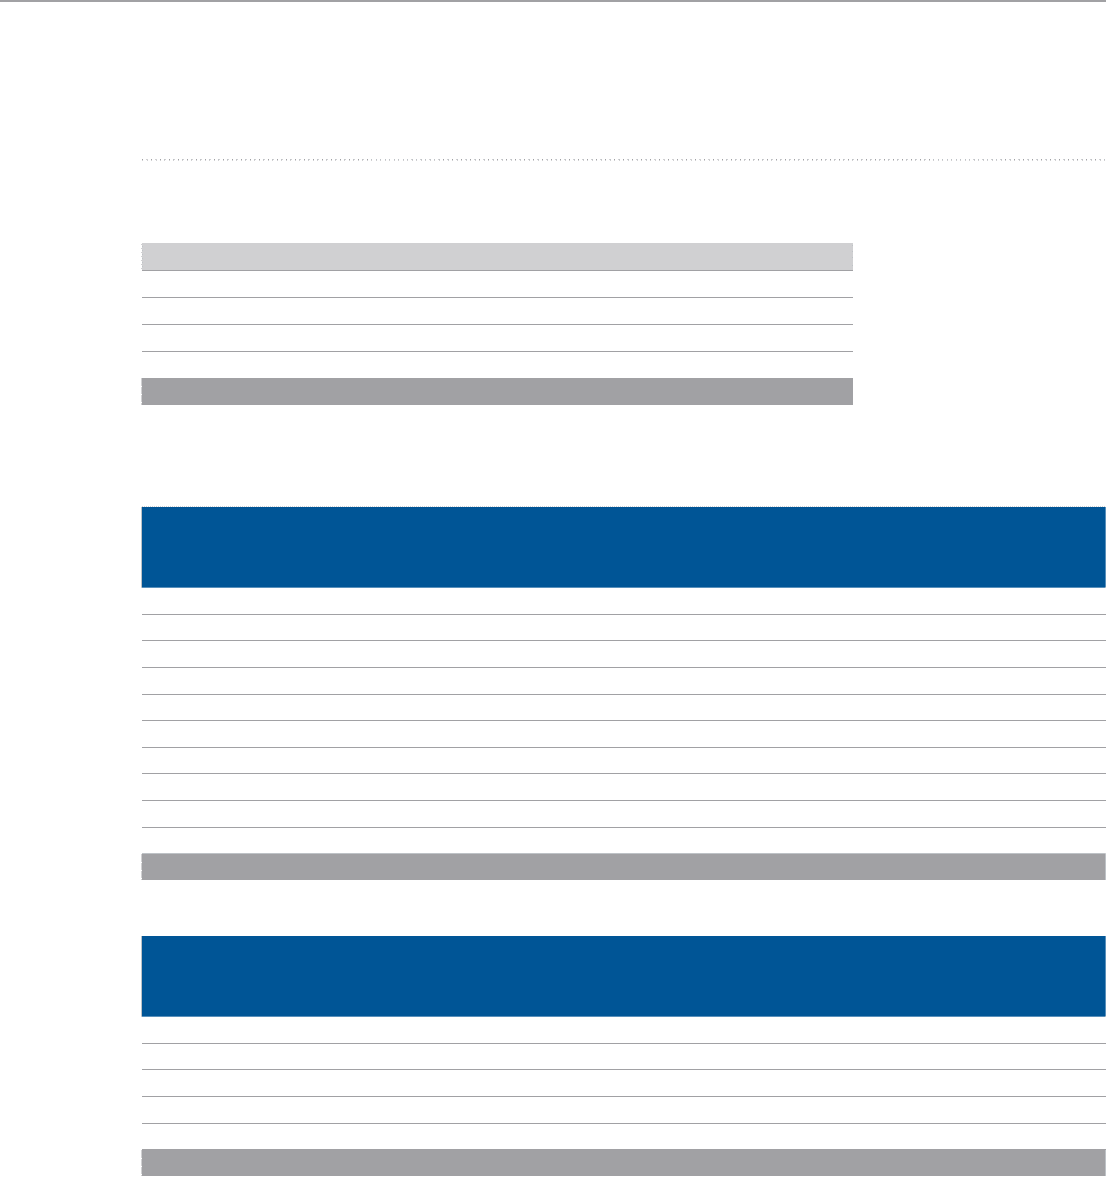
The movement of deferred income tax assets and liabilities during the year, without taking
into consideration the offsetting of balances within the same tax jurisdiction, is as follows:
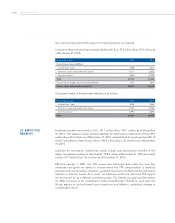
Deferred tax assets
(thousands of Euro)
As of
January 1,
2012
Exchange rate
difference
and other
movements
Business
combinations
Income
statements
Tax charged/
(credited)
to equity
As of
December 31,
2012
Inventories 78,264 (2,013) 5,127 21,678 - 103,056
Insurance and other reserves 10,923 (137) - 557 - 11,343
Net operating loss carry forwards 16,191 3,657 (948) (12,441) - 6,459
Rights of return 11,194 3,234 1,103 551 - 16,082
Deferred tax on derivatives 7,484 55 - (1,017) (6,484) 38
Employee related reserves 90,473 (13,837) - 13,652 14,120 104,408
Occupancy reserves 18,275 (837) - 928 - 18,366
Trade names 84,278 (2,553) - 767 (67) 82,425
Fixed assets 10,369 3,658 - 202 - 14,229
Other 50,288 (18,286) 6,037 5,653 67 43,759
Total 377,739 (27,059) 11,319 30,530 7,636 400,163
Deferred tax liabilities
(thousands of Euro)
As of
January 1,
2012
Exchange rate
difference
and other
movements
Business
combinations
Income
statements
Tax charged/
(credited) to
equity
As of
December 31,
2012
Dividends 6,155 - - (592) - 5,563
Trade names 233,729 (5,585) 23,433 (17,620) - 233,957
Fixed assets 66,120 (24,358) - 13,729 - 55,491
Other intangibles 140,682 16,372 (7,305) 2,093 - 151,842
Other 9,688 3,444 80 4,009 (5,767) 11,454
Total 456,375 (10,127) 16,208 1,619 (5,767) 458,307