LensCrafters 2012 Annual Report Download - page 112
Download and view the complete annual report
Please find page 112 of the 2012 LensCrafters annual report below. You can navigate through the pages in the report by either clicking on the pages listed below, or by using the keyword search tool below to find specific information within the annual report.-
 1
1 -
2
-
3
-
4
-
5
-
6
-
7
-
8
-
9
-
10
-
11
-
12
-
13
-
14
-
15
-
16
-
17
-
18
-
19
-
20
-
21
-
22
-
23
-
24
-
25
-
26
-
27
-
28
-
29
-
30
-
31
-
32
-
33
-
34
-
35
-
36
-
37
-
38
-
39
-
40
-
41
-
42
-
43
-
44
-
45
-
46
-
47
-
48
-
49
-
50
-
51
-
52
-
53
-
54
-
55
-
56
-
57
-
58
-
59
-
60
-
61
-
62
-
63
-
64
-
65
-
66
-
67
-
68
-
69
-
70
-
71
-
72
-
73
-
74
-
75
-
76
-
77
-
78
-
79
-
80
-
81
-
82
-
83
-
84
-
85
-
86
-
87
-
88
-
89
-
90
-
91
-
92
-
93
-
94
-
95
-
96
-
97
-
98
-
99
-
100
-
101
-
 102
102 -
 103
103 -
 104
104 -
 105
105 -
 106
106 -
 107
107 -
 108
108 -
 109
109 -
 110
110 -
 111
111 -
 112
112 -
 113
113 -
 114
114 -
 115
115 -
 116
116 -
 117
117 -
 118
118 -
 119
119 -
 120
120 -
 121
121 -
 122
122 -
123
-
124
-
125
-
126
-
127
-
128
-
129
-
130
-
131
-
132
-
133
-
134
-
135
-
136
-
137
-
138
-
139
-
140
-
141
-
142
-
143
-
144
-
145
-
146
-
147
-
148
-
149
-
150
-
151
-
152
-
153
-
154
-
155
-
156
-
157
-
158
-
159
-
160
-
161
-
162
-
163
-
164
-
165
-
166
-
167
-
168
-
169
-
170
-
171
-
172
-
173
-
174
-
175
-
176
-
177
-
178
-
179
-
180
-
181
-
182
-
183
-
184
-
185
-
186
-
187
-
188
-
189
-
190
-
191
-
192
-
193
-
194
-
195
-
196
-
197
-
198
-
199
-
200
-
201
-
202
-
203
-
204
-
205
-
206
-
207
-
208
-
209
-
210
-
211
-
212
-
213
-
214
-
215
-
216
-
217
-
218
-
219
-
220
-
221
-
222
-
223
-
224
-
225
-
226
-
227
-
228
-
229
-
230
-
231
-
232
-
233
-
234
-
235
-
236
-
237
-
238
-
239
-
240
-
241
-
242
-
243
-
244
-
245
-
246
-
247
-
248
-
249
-
250
-
251
-
252
-
253
-
254
-
255
-
256
-
257
-
258
-
259
-
260
-
261
-
262
-
263
-
264
-
265
-
266
-
267
-
268
-
269
-
270
-
271
-
272
-
273
-
274
-
275
-
276
-
277
-
278
-
279
 |
 |

ANNUAL REPORT 2012> 26 |
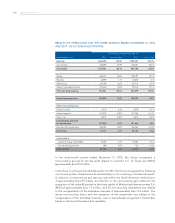
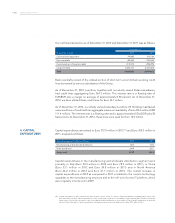
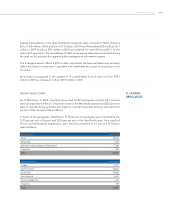
Our net financial position as of December 31, 2012 and December 31, 2011 was as follows:
December 31,
(thousands of Euro) 2012 2011
Cash and cash equivalents 790,093 905,100
Bank overdrafts (90,284) (193,834)
Current portion of long-term debt (310,072) (498,295)
Long-term debt (2,052,107) (2,244,583)
Total (1,662,369) (2,031,612)
Bank overdrafts consist of the utilized portion of short-term uncommitted revolving credit
lines borrowed by various subsidiaries of the Group.
As of December 31, 2012, Luxottica, together with our wholly owned Italian subsidiaries,
had credit lines aggregating Euro 369.3 million. The interest rate is a floating rate of
EURIBOR plus a margin on average of approximately 0.50 percent. As of December 31,
2012, we have utilized these credit lines for Euro36.7 million.
As of December 31, 2012, our wholly owned subsidiary Luxottica US Holdings maintained
unsecured lines of credit with an aggregate maximum availability of Euro84.4 million (USD
111.4 million). The interest rate is a floating rate and is approximately USD LIBOR plus 50
basis points. At December 31, 2012, these lines were used for Euro14.0 million.
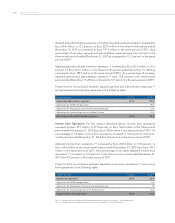
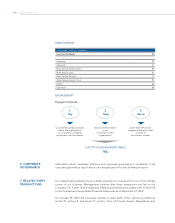
Capital expenditures amounted to Euro372.9 million in 2012 (28) and Euro358.3 million in
2011, analyzed as follows:
Operating segment (millions of Euro) 2012 2011
Manufacturing and wholesale distribution 148.0 153.2
Retail distribution 224.9 205.1
Group total 372.9 358.3
Capital expenditures in the manufacturing and wholesale distribution segment were
primarily in Italy (Euro 59.4 million in 2012 and Euro 78.9 million in 2011), in China
(Euro 33.1 million in 2012 and Euro 24.8 million in 2011) and in North America
(Euro 46.2 million in 2012 and Euro 41.1 million in 2011). The overall increase in
capital expenditures in 2012 as compared to 2011 is related to the routine technology
upgrades to the manufacturing structure and to the roll-out of a new IT platform, which
was originally introduced in 2009.
(28) Capital expenditures in 2012 include Retail division nance leases of Euro7.9 million. Capital expenditures excluding nance leases were
Euro365.0 million in 2012. Capital expenditures in 2011 include (i) the acquisition of a building for approximately Euro25 million (for further
details please see note 28 to the Notes to the Consolidated Financial Statements as of December 31, 2011) and (ii) capital leases of the Retail
division of Euro25.6 million. Capital expenditures excluding the above mentioned additions were Euro307.5 million in 2011.
4. CAPITAL
EXPENDITURES