LensCrafters 2012 Annual Report Download - page 134
Download and view the complete annual report
Please find page 134 of the 2012 LensCrafters annual report below. You can navigate through the pages in the report by either clicking on the pages listed below, or by using the keyword search tool below to find specific information within the annual report.-
 1
1 -
2
-
3
-
4
-
5
-
6
-
7
-
8
-
9
-
10
-
11
-
12
-
13
-
14
-
15
-
16
-
17
-
18
-
19
-
20
-
21
-
22
-
23
-
24
-
25
-
26
-
27
-
28
-
29
-
30
-
31
-
32
-
33
-
34
-
35
-
36
-
37
-
38
-
39
-
40
-
41
-
42
-
43
-
44
-
45
-
46
-
47
-
48
-
49
-
50
-
51
-
52
-
53
-
54
-
55
-
56
-
57
-
58
-
59
-
60
-
61
-
62
-
63
-
64
-
65
-
66
-
67
-
68
-
69
-
70
-
71
-
72
-
73
-
74
-
75
-
76
-
77
-
78
-
79
-
80
-
81
-
82
-
83
-
84
-
85
-
86
-
87
-
88
-
89
-
90
-
91
-
92
-
93
-
94
-
95
-
96
-
97
-
98
-
99
-
100
-
101
-
102
-
103
-
104
-
105
-
106
-
107
-
108
-
109
-
110
-
111
-
112
-
113
-
114
-
115
-
116
-
117
-
118
-
119
-
120
-
121
-
122
-
123
-
 124
124 -
 125
125 -
 126
126 -
 127
127 -
 128
128 -
 129
129 -
 130
130 -
 131
131 -
 132
132 -
 133
133 -
 134
134 -
 135
135 -
 136
136 -
 137
137 -
 138
138 -
 139
139 -
 140
140 -
 141
141 -
 142
142 -
 143
143 -
 144
144 -
145
-
146
-
147
-
148
-
149
-
150
-
151
-
152
-
153
-
154
-
155
-
156
-
157
-
158
-
159
-
160
-
161
-
162
-
163
-
164
-
165
-
166
-
167
-
168
-
169
-
170
-
171
-
172
-
173
-
174
-
175
-
176
-
177
-
178
-
179
-
180
-
181
-
182
-
183
-
184
-
185
-
186
-
187
-
188
-
189
-
190
-
191
-
192
-
193
-
194
-
195
-
196
-
197
-
198
-
199
-
200
-
201
-
202
-
203
-
204
-
205
-
206
-
207
-
208
-
209
-
210
-
211
-
212
-
213
-
214
-
215
-
216
-
217
-
218
-
219
-
220
-
221
-
222
-
223
-
224
-
225
-
226
-
227
-
228
-
229
-
230
-
231
-
232
-
233
-
234
-
235
-
236
-
237
-
238
-
239
-
240
-
241
-
242
-
243
-
244
-
245
-
246
-
247
-
248
-
249
-
250
-
251
-
252
-
253
-
254
-
255
-
256
-
257
-
258
-
259
-
260
-
261
-
262
-
263
-
264
-
265
-
266
-
267
-
268
-
269
-
270
-
271
-
272
-
273
-
274
-
275
-
276
-
277
-
278
-
279
 |
 |

ANNUAL REPORT 2012> 48 |
generate cash from operations in excess of our cash expenses;
• ensure that this measure is fully understood in light of how we evaluate our operating
results;
• properly define the metrics used and confirm their calculation; and
• share this measure with all investors at the same time.
Free cash flow is not meant to be considered in isolation or as a substitute for items
appearing on our financial statements prepared in accordance with IFRS. Rather, this non-
IFRS measure should be used as a supplement to IFRS results to assist the reader in better
understanding the operational performance of the Group.
The Group cautions that this measure is not a defined term under IFRS and its definition
should be carefully reviewed and understood by investors.
Investors should be aware that our method of calculation of free cash flow may differ from
methods used by other companies. We recognize that the usefulness of free cash flow as
an evaluative tool may have certain limitations, including:
• the manner in which we calculate free cash flow may differ from that of other companies,
which limits its usefulness as a comparative measure;
• free cash flow does not represent the total increase or decrease in the net debt
balance for the period since it excludes, among other things, cash used for funding
discretionary investments and to pursue strategic opportunities during the period and
any impact of the exchange rate changes; and
• free cash flow can be subject to adjustment at our discretion if we take steps or adopt
policies that increase or diminish our current liabilities and/or changes to working
capital.
We compensate for the foregoing limitations by using free cash flow as one of several
comparative tools, together with IFRS measurements, to assist in the evaluation of our
operating performance.
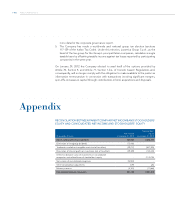
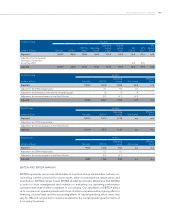
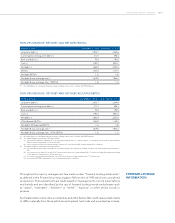
The following table provides a reconciliation of free cash flow to EBITDA and the table
above provides a reconciliation of EBITDA to net income, which is the most directly
comparable IFRS financial measure:
NON-IFRS MEASURE: FREE CASH FLOW
(millions of Euro) FY 2012
Adjusted EBITDA (1) 1,362
C working capital 114
Capex (365)
Operating cash flow 1,111
Financial charges (2) (119)
Taxes (266)
Other - net (6)
Free cash flow 720
(1) EBITDA is not an IFRS measure; please see table on the earlier page for a reconciliation of EBITDA to net income.
(2) Equals interest income minus interest expense.