LensCrafters 2012 Annual Report Download - page 192
Download and view the complete annual report
Please find page 192 of the 2012 LensCrafters annual report below. You can navigate through the pages in the report by either clicking on the pages listed below, or by using the keyword search tool below to find specific information within the annual report.-
 1
1 -
2
-
3
-
4
-
5
-
6
-
7
-
8
-
9
-
10
-
11
-
12
-
13
-
14
-
15
-
16
-
17
-
18
-
19
-
20
-
21
-
22
-
23
-
24
-
25
-
26
-
27
-
28
-
29
-
30
-
31
-
32
-
33
-
34
-
35
-
36
-
37
-
38
-
39
-
40
-
41
-
42
-
43
-
44
-
45
-
46
-
47
-
48
-
49
-
50
-
51
-
52
-
53
-
54
-
55
-
56
-
57
-
58
-
59
-
60
-
61
-
62
-
63
-
64
-
65
-
66
-
67
-
68
-
69
-
70
-
71
-
72
-
73
-
74
-
75
-
76
-
77
-
78
-
79
-
80
-
81
-
82
-
83
-
84
-
85
-
86
-
87
-
88
-
89
-
90
-
91
-
92
-
93
-
94
-
95
-
96
-
97
-
98
-
99
-
100
-
101
-
102
-
103
-
104
-
105
-
106
-
107
-
108
-
109
-
110
-
111
-
112
-
113
-
114
-
115
-
116
-
117
-
118
-
119
-
120
-
121
-
122
-
123
-
124
-
125
-
126
-
127
-
128
-
129
-
130
-
131
-
132
-
133
-
134
-
135
-
136
-
137
-
138
-
139
-
140
-
141
-
142
-
143
-
144
-
145
-
146
-
147
-
148
-
149
-
150
-
151
-
152
-
153
-
154
-
155
-
156
-
157
-
158
-
159
-
160
-
161
-
162
-
163
-
164
-
165
-
166
-
167
-
168
-
169
-
170
-
171
-
172
-
173
-
174
-
175
-
176
-
177
-
178
-
179
-
180
-
181
-
 182
182 -
 183
183 -
 184
184 -
 185
185 -
 186
186 -
 187
187 -
 188
188 -
 189
189 -
 190
190 -
 191
191 -
 192
192 -
 193
193 -
 194
194 -
 195
195 -
 196
196 -
 197
197 -
 198
198 -
 199
199 -
 200
200 -
 201
201 -
 202
202 -
203
-
204
-
205
-
206
-
207
-
208
-
209
-
210
-
211
-
212
-
213
-
214
-
215
-
216
-
217
-
218
-
219
-
220
-
221
-
222
-
223
-
224
-
225
-
226
-
227
-
228
-
229
-
230
-
231
-
232
-
233
-
234
-
235
-
236
-
237
-
238
-
239
-
240
-
241
-
242
-
243
-
244
-
245
-
246
-
247
-
248
-
249
-
250
-
251
-
252
-
253
-
254
-
255
-
256
-
257
-
258
-
259
-
260
-
261
-
262
-
263
-
264
-
265
-
266
-
267
-
268
-
269
-
270
-
271
-
272
-
273
-
274
-
275
-
276
-
277
-
278
-
279
 |
 |
ANNUAL REPORT 2012> 106 |
Accounts receivable and other receivables
Accounts receivable and other receivables are carried at amortized cost. Losses on
receivables are measured as the difference between the receivables’ carrying amount and
the present value of estimated future cash flows discounted at the receivables’ original
effective interest rate computed at the time of initial recognition. The carrying amount of
the receivables is reduced through an allowance for doubtful accounts. The amount of the
losses on written-off accounts is recorded in the consolidated statement of income within
selling expenses.
Subsequent collections of previously written-off receivables are recorded in the
consolidated statement of income as a reduction of selling expenses.
Inventories
Inventories are stated at the lower of the cost determined by using the average annual
cost method by product line, which approximates the weighted average cost, and the net
realizable value. Provisions for write-downs for raw materials and finished goods which are
considered obsolete or slow moving are computed taking into account their expected
future utilization and their realizable value. The realizable value represents the estimated
sales price, net of estimated sales and distribution costs.
Property, plant and equipment
Property, plant and equipment are measured at historical cost. Historical cost includes
expenditures that are directly attributable to the acquisition of the items. After
initial recognition, property, plant and equipment is carried at cost less accumulated
depreciation and any accumulated impairment loss. The depreciable amount of the
items of property, plant and equipment, measured as the difference between their cost
and their residual value, is allocated on a straight-line basis over their estimated useful
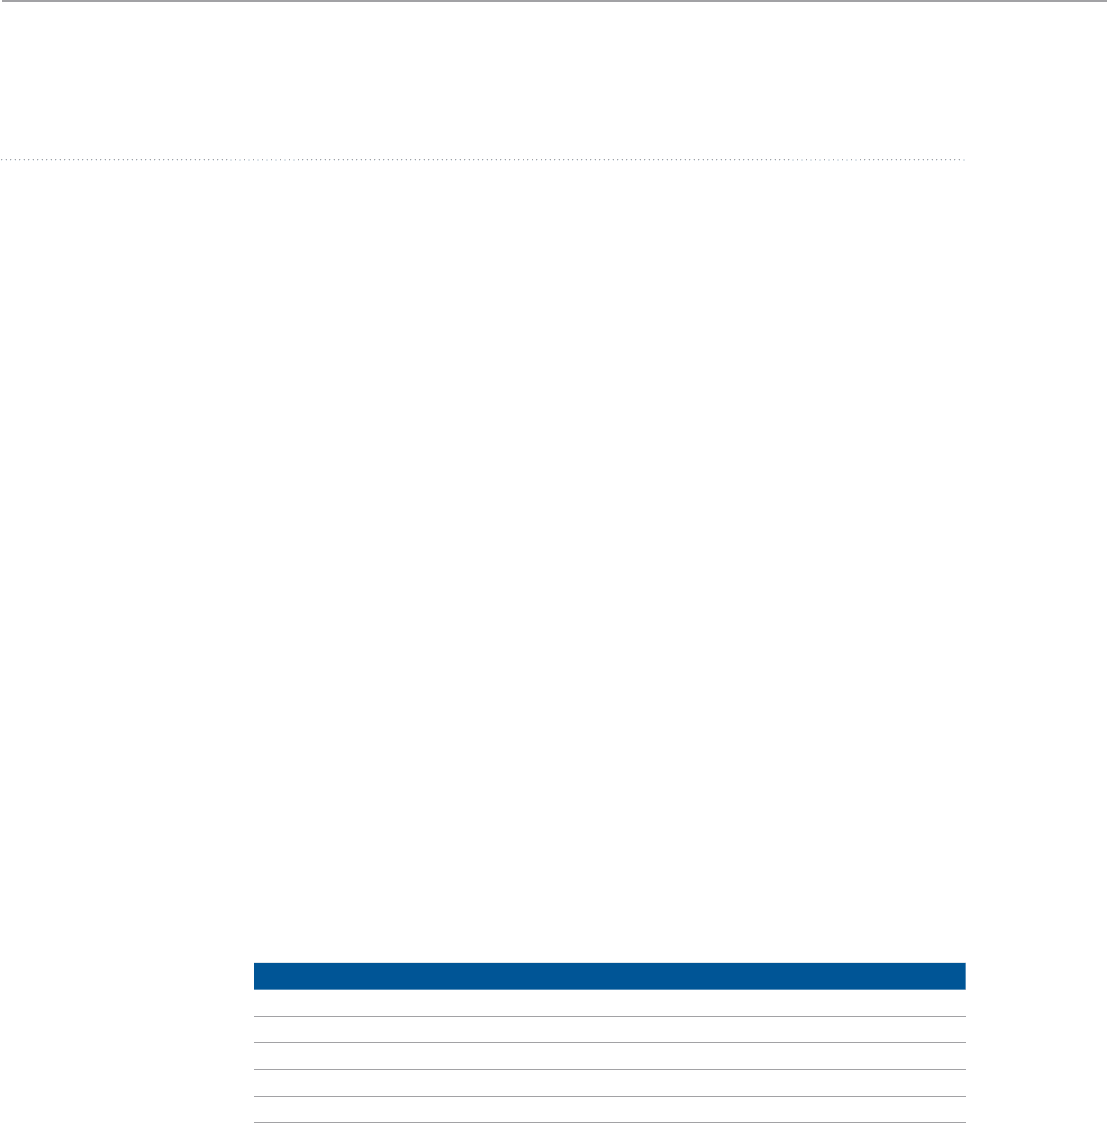
lives as follows:
Estimated useful life
Buildings and building improvements From 19 to 40 years
Machinery and equipment From 3 to 12 years
Aircraft 25 years
Other equipment From 5 to 8 years
Leasehold improvements The lower of 15 years or the residual duration of the lease contract
Depreciation ends on the date on which the asset is classified as held for sale, in compliance
with IFRS 5 - Non-Current Assets Held for Sale and Discontinued Operations.
Subsequent costs are included in the asset’s carrying amount or recognized as a separate
asset, as appropriate, only when it is probable that future economic benefits associated
with the item will flow to the Group and the cost of the item can be measured reliably. The
carrying amount of the replaced part is derecognized. All other repairs and maintenance