LensCrafters 2012 Annual Report Download - page 105
Download and view the complete annual report
Please find page 105 of the 2012 LensCrafters annual report below. You can navigate through the pages in the report by either clicking on the pages listed below, or by using the keyword search tool below to find specific information within the annual report.-
 1
1 -
2
-
3
-
4
-
5
-
6
-
7
-
8
-
9
-
10
-
11
-
12
-
13
-
14
-
15
-
16
-
17
-
18
-
19
-
20
-
21
-
22
-
23
-
24
-
25
-
26
-
27
-
28
-
29
-
30
-
31
-
32
-
33
-
34
-
35
-
36
-
37
-
38
-
39
-
40
-
41
-
42
-
43
-
44
-
45
-
46
-
47
-
48
-
49
-
50
-
51
-
52
-
53
-
54
-
55
-
56
-
57
-
58
-
59
-
60
-
61
-
62
-
63
-
64
-
65
-
66
-
67
-
68
-
69
-
70
-
71
-
72
-
73
-
74
-
75
-
76
-
77
-
78
-
79
-
80
-
81
-
82
-
83
-
84
-
85
-
86
-
87
-
88
-
89
-
90
-
91
-
92
-
93
-
94
-
 95
95 -
 96
96 -
 97
97 -
 98
98 -
 99
99 -
 100
100 -
 101
101 -
 102
102 -
 103
103 -
 104
104 -
 105
105 -
 106
106 -
 107
107 -
 108
108 -
 109
109 -
 110
110 -
 111
111 -
 112
112 -
 113
113 -
 114
114 -
 115
115 -
116
-
117
-
118
-
119
-
120
-
121
-
122
-
123
-
124
-
125
-
126
-
127
-
128
-
129
-
130
-
131
-
132
-
133
-
134
-
135
-
136
-
137
-
138
-
139
-
140
-
141
-
142
-
143
-
144
-
145
-
146
-
147
-
148
-
149
-
150
-
151
-
152
-
153
-
154
-
155
-
156
-
157
-
158
-
159
-
160
-
161
-
162
-
163
-
164
-
165
-
166
-
167
-
168
-
169
-
170
-
171
-
172
-
173
-
174
-
175
-
176
-
177
-
178
-
179
-
180
-
181
-
182
-
183
-
184
-
185
-
186
-
187
-
188
-
189
-
190
-
191
-
192
-
193
-
194
-
195
-
196
-
197
-
198
-
199
-
200
-
201
-
202
-
203
-
204
-
205
-
206
-
207
-
208
-
209
-
210
-
211
-
212
-
213
-
214
-
215
-
216
-
217
-
218
-
219
-
220
-
221
-
222
-
223
-
224
-
225
-
226
-
227
-
228
-
229
-
230
-
231
-
232
-
233
-
234
-
235
-
236
-
237
-
238
-
239
-
240
-
241
-
242
-
243
-
244
-
245
-
246
-
247
-
248
-
249
-
250
-
251
-
252
-
253
-
254
-
255
-
256
-
257
-
258
-
259
-
260
-
261
-
262
-
263
-
264
-
265
-
266
-
267
-
268
-
269
-
270
-
271
-
272
-
273
-
274
-
275
-
276
-
277
-
278
-
279
 |
 |

| 19 >MANAGEMENT REPORT
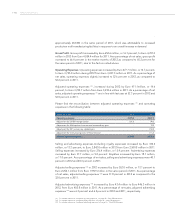
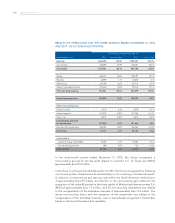
Operating Expenses. Total operating expenses increased by Euro 80.0 million, or 9.6
percent, to Euro914.4 million in the three-month period ended December 31, 2012 from
Euro834.4 million in the same period of 2011. As a percentage of net sales, operating
expenses increased to 56.0 percent in the three-month period ended December 31, 2012,
from 55.3 percent in the same period of 2011.
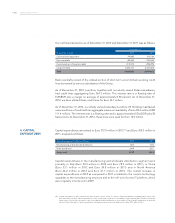
Total adjusted operating expenses (21) increased by Euro90.9 million, or 11.0 percent, to
Euro914.4 million in the three-month period ended December 31, 2012 from Euro823.5
million in the same period of 2011. As a percentage of net sales, adjusted operating
expenses(21) were 56.0 percent in the three-month period ended December 31, 2012 as
compared to the 54.6 percent in the same period of 2011.
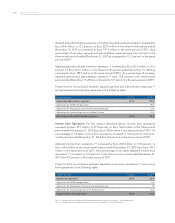
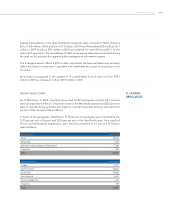
Please find the reconciliation between adjusted operating expenses (21) and operation
expenses in the following table:
(millions of Euro) 4Q 2012 4Q 2011
Operating expenses 914.4 834.4
Adjustment for OPSM reorganization - (9.6)
Adjustment for Multiopticas Internacional extraordinary gain - (1.9)
Adjustment for restructuring costs in the Retail Division - 0.6
Adjusted operation expenses 914.4 823.5
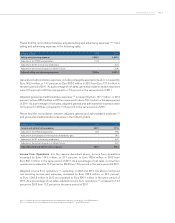
Selling and advertising expenses (including royalty expenses) increased by Euro 55.6
million, or 8.7 percent, to Euro692.8 million in the three-month period ended December
31, 2012 from Euro637.1 million in the same period of 2011. Selling expenses increased by
Euro55.9 million, or 11.0 percent. Advertising expenses decreased by Euro(1.0) million,
or (1.0) percent. Royalties increased by Euro0.7 million, or 2.9 percent. As a percentage of
net sales, selling and advertising expenses are in line at 42.4 percent in the three-month
period ended December 31, 2012, compared to 42.2 percent for the same period of 2011.
Adjusted selling expenses (22) increased by Euro51.8 million or 10.1 percent to Euro565.1
million in the three months ended December 31, 2012, as compared to Euro513.3 million
in the same period of 2011. As a percentage of net sales, adjusted selling expenses(22)
were 34.6 percent in the three-month period ended December 31, 2012 as compared to
34.0 percent in the same period of last year.
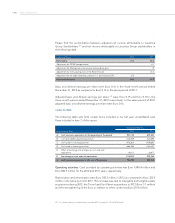
Please find the reconciliation between adjusted selling expenses (22) and selling expenses
in the following table:
(millions of Euro) 4Q 2012 4Q 2011
Selling and advertising expenses 692.8 637.1
Adjustment for restructuring costs in the Retail Division - 4.1
Adjusted selling and advertising expenses 692.8 641.2
(21) For a further discussion of adjusted operating expenses, see page 43 - “Non-IFRS Measures”.
(22) For a further discussion of adjusted selling expenses, see page 43 - “Non-IFRS Measures”.