LensCrafters 2012 Annual Report Download - page 96
Download and view the complete annual report
Please find page 96 of the 2012 LensCrafters annual report below. You can navigate through the pages in the report by either clicking on the pages listed below, or by using the keyword search tool below to find specific information within the annual report.-
 1
1 -
2
-
3
-
4
-
5
-
6
-
7
-
8
-
9
-
10
-
11
-
12
-
13
-
14
-
15
-
16
-
17
-
18
-
19
-
20
-
21
-
22
-
23
-
24
-
25
-
26
-
27
-
28
-
29
-
30
-
31
-
32
-
33
-
34
-
35
-
36
-
37
-
38
-
39
-
40
-
41
-
42
-
43
-
44
-
45
-
46
-
47
-
48
-
49
-
50
-
51
-
52
-
53
-
54
-
55
-
56
-
57
-
58
-
59
-
60
-
61
-
62
-
63
-
64
-
65
-
66
-
67
-
68
-
69
-
70
-
71
-
72
-
73
-
74
-
75
-
76
-
77
-
78
-
79
-
80
-
81
-
82
-
83
-
84
-
85
-
 86
86 -
 87
87 -
 88
88 -
 89
89 -
 90
90 -
 91
91 -
 92
92 -
 93
93 -
 94
94 -
 95
95 -
 96
96 -
 97
97 -
 98
98 -
 99
99 -
 100
100 -
 101
101 -
 102
102 -
 103
103 -
 104
104 -
 105
105 -
 106
106 -
107
-
108
-
109
-
110
-
111
-
112
-
113
-
114
-
115
-
116
-
117
-
118
-
119
-
120
-
121
-
122
-
123
-
124
-
125
-
126
-
127
-
128
-
129
-
130
-
131
-
132
-
133
-
134
-
135
-
136
-
137
-
138
-
139
-
140
-
141
-
142
-
143
-
144
-
145
-
146
-
147
-
148
-
149
-
150
-
151
-
152
-
153
-
154
-
155
-
156
-
157
-
158
-
159
-
160
-
161
-
162
-
163
-
164
-
165
-
166
-
167
-
168
-
169
-
170
-
171
-
172
-
173
-
174
-
175
-
176
-
177
-
178
-
179
-
180
-
181
-
182
-
183
-
184
-
185
-
186
-
187
-
188
-
189
-
190
-
191
-
192
-
193
-
194
-
195
-
196
-
197
-
198
-
199
-
200
-
201
-
202
-
203
-
204
-
205
-
206
-
207
-
208
-
209
-
210
-
211
-
212
-
213
-
214
-
215
-
216
-
217
-
218
-
219
-
220
-
221
-
222
-
223
-
224
-
225
-
226
-
227
-
228
-
229
-
230
-
231
-
232
-
233
-
234
-
235
-
236
-
237
-
238
-
239
-
240
-
241
-
242
-
243
-
244
-
245
-
246
-
247
-
248
-
249
-
250
-
251
-
252
-
253
-
254
-
255
-
256
-
257
-
258
-
259
-
260
-
261
-
262
-
263
-
264
-
265
-
266
-
267
-
268
-
269
-
270
-
271
-
272
-
273
-
274
-
275
-
276
-
277
-
278
-
279
 |
 |
ANNUAL REPORT 2012> 10 |
its financial results: (i) non-recurring expenses related to the restructuring of the Australian
retail business of Euro21.7 million (Euro15,2 million net of the fiscal effect), (ii) non-recurring
cost related to the tax audit of one of Luxottica’s subsidiaries of approximately Euro10.0
million. During 2011, the Group recognized the following non-recurring income and
expenses: (i) an extraordinary gain related to the acquisition of the initial 40 percent of
Multiopticas Internacional S.A. (MOI) of approximately Euro19.0 million, (ii) non-recurring
expenses related to Luxottica’s 50th anniversary celebrations of approximately Euro 12.0
million, (iii) non-recurring restructuring and start-up costs in the retail distribution segment
of approximately Euro 11.2 million, and (iv) non-recurring impairment loss related to the
reorganization of the Australian retail business of approximately Euro9.6 million.
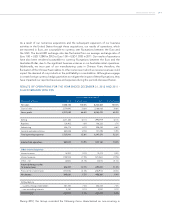
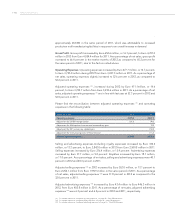
The income from operations, EBITDA and net income attributable to the Luxottica Group
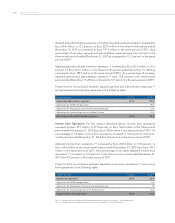
stockholders adjusted to exclude the above non-recurring items would be as follow:
ADJUSTED MEASURES (9)
2012 % of net sales 2011 % of net sales % change
Adjusted income from operations 1,003,757 14.2% 820,863 13.2% 22.3%
Adjusted EBITDA 1,362,043 19.2% 1,135,852 18.3% 19.9%
Adjusted Net Income attributable to Luxottica Group
Stockholders 566,895 8.0% 455,613 7.3% 24.4%
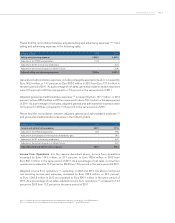
Net Sales. Net sales increased by Euro863.6 million, or 13.9 percent, to Euro7,086.1 million in
2012 from Euro6,222.5 million in the same period of 2011. Euro316.7 million of such increase
was attributable to the increased sales in the manufacturing and wholesale distribution
segment in the twelve months of 2012 as compared to the same period in 2011 and in the
retail distribution segment of Euro546.9 million for the same period.
Net sales for the retail distribution segment increased by Euro546.9 million, or 14.5 percent,
to Euro4,313.1 million in 2012 from Euro3,766.1 million in 2011. The increase in net sales
for the period was partially attributable to a 5.8 percent improvement in comparable store
sales (10). In particular, there was a 5.5 percent increase in comparable store sales for the
North American retail operations, and an increase for the Australian/New Zealand retail
operations of 6.5 percent. The effects from currency fluctuations between the Euro(which
is our reporting currency) and other currencies in which we conduct business, in particular
the strengthening of the U.S. Dollar and Australian Dollar compared to the Euro, increased
net sales in the retail distribution segment by Euro327.3 million during the period.
Net sales to third parties in the manufacturing and wholesale distribution segment increased
by Euro316.7 million, or 12.9 percent, to Euro2,773.1 million in 2012 from Euro2,456.3 million
in 2011. This increase was mainly attributable to increased sales of most of our house brands,
in particular Ray-Ban and Oakley, which recorded high single digit optical growth, and Persol,
and of some designer brands such as Burberry, Prada, Polo, Tiffany and the additional sales
(9) Adjusted measures are not in accordance with IFRS. For a further discussion of adjusted measures, see page 43 - “Non-IFRS Measures”.
(10) Comparable store sales reects the change in sales from one period to another that, for comparison purposes, includes in the calculation only
stores open in the more recent period that also were open during the comparable prior period in the same geographic area, and applies to
both periods the average exchange rate for the prior period.