LensCrafters 2012 Annual Report Download - page 97
Download and view the complete annual report
Please find page 97 of the 2012 LensCrafters annual report below. You can navigate through the pages in the report by either clicking on the pages listed below, or by using the keyword search tool below to find specific information within the annual report.-
 1
1 -
2
-
3
-
4
-
5
-
6
-
7
-
8
-
9
-
10
-
11
-
12
-
13
-
14
-
15
-
16
-
17
-
18
-
19
-
20
-
21
-
22
-
23
-
24
-
25
-
26
-
27
-
28
-
29
-
30
-
31
-
32
-
33
-
34
-
35
-
36
-
37
-
38
-
39
-
40
-
41
-
42
-
43
-
44
-
45
-
46
-
47
-
48
-
49
-
50
-
51
-
52
-
53
-
54
-
55
-
56
-
57
-
58
-
59
-
60
-
61
-
62
-
63
-
64
-
65
-
66
-
67
-
68
-
69
-
70
-
71
-
72
-
73
-
74
-
75
-
76
-
77
-
78
-
79
-
80
-
81
-
82
-
83
-
84
-
85
-
86
-
 87
87 -
 88
88 -
 89
89 -
 90
90 -
 91
91 -
 92
92 -
 93
93 -
 94
94 -
 95
95 -
 96
96 -
 97
97 -
 98
98 -
 99
99 -
 100
100 -
 101
101 -
 102
102 -
 103
103 -
 104
104 -
 105
105 -
 106
106 -
 107
107 -
108
-
109
-
110
-
111
-
112
-
113
-
114
-
115
-
116
-
117
-
118
-
119
-
120
-
121
-
122
-
123
-
124
-
125
-
126
-
127
-
128
-
129
-
130
-
131
-
132
-
133
-
134
-
135
-
136
-
137
-
138
-
139
-
140
-
141
-
142
-
143
-
144
-
145
-
146
-
147
-
148
-
149
-
150
-
151
-
152
-
153
-
154
-
155
-
156
-
157
-
158
-
159
-
160
-
161
-
162
-
163
-
164
-
165
-
166
-
167
-
168
-
169
-
170
-
171
-
172
-
173
-
174
-
175
-
176
-
177
-
178
-
179
-
180
-
181
-
182
-
183
-
184
-
185
-
186
-
187
-
188
-
189
-
190
-
191
-
192
-
193
-
194
-
195
-
196
-
197
-
198
-
199
-
200
-
201
-
202
-
203
-
204
-
205
-
206
-
207
-
208
-
209
-
210
-
211
-
212
-
213
-
214
-
215
-
216
-
217
-
218
-
219
-
220
-
221
-
222
-
223
-
224
-
225
-
226
-
227
-
228
-
229
-
230
-
231
-
232
-
233
-
234
-
235
-
236
-
237
-
238
-
239
-
240
-
241
-
242
-
243
-
244
-
245
-
246
-
247
-
248
-
249
-
250
-
251
-
252
-
253
-
254
-
255
-
256
-
257
-
258
-
259
-
260
-
261
-
262
-
263
-
264
-
265
-
266
-
267
-
268
-
269
-
270
-
271
-
272
-
273
-
274
-
275
-
276
-
277
-
278
-
279
 |
 |

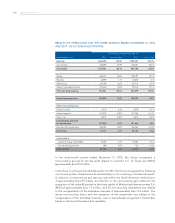
| 11 >MANAGEMENT REPORT
of Coach, launched in January 2012. In addition there was a positive net sales impact of
Euro71.1 million due to positive currency fluctuations, in particular the strengthening of the
U.S. Dollar and other minor currencies, including but not limited to the Japanese Yen and
Canadian Dollar, partially offset by weakening of the Brazilian Real.
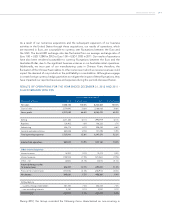
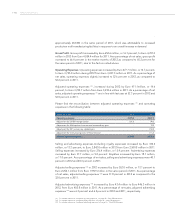
During 2012, net sales in the retail distribution segment accounted for approximately 60.9
percent of total net sales, as compared to approximately 60.5 percent of total net sales
for the same period in 2011. This increase in sales for the retail distribution segment as a
percentage of total net sales was primarily attributable to a 14.5 percent increase in net
sales to third parties for the twelve months of 2012 as compared to the same period of 2011,
which exceeded a 12.9 percent increase in net sales for the manufacturing and wholesale
distribution segment for the twelve months of 2012 as compared to the same period of 2011.
In 2012, net sales in our retail distribution segment in the United States and Canada
comprised 78.4 percent of total net sales in this segment as compared to 79.9 percent
of total net sales in 2011. In U.S. Dollars, retail net sales in the United States and Canada
increased by 3.7 percent to USD 4,343.5 million in 2012 from USD 4,188.4 million for the
same period in 2011, due to sales volume increases. During 2012, net sales in the retail
distribution segment in the rest of the world (excluding the United States and Canada)
comprised 21.6 percent of total net sales in this segment and increased by 23.1 percent
to Euro932.4 million in the twelve months of 2012 from Euro757.2 million, or 20.1 percent
of total retail net sales for the same period in 2011, mainly due to a general increase in
consumer demand and to the contribution to sales for the whole 2012 by Multiopticas, our
newly acquired retail chain in South America.
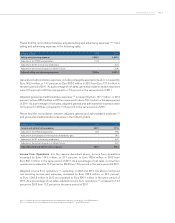
During 2012, net sales to third parties in our manufacturing and wholesale distribution
segment in Europe were Euro1,183.3 million, comprising 42.7 percent of our total net
sales in this segment, as compared to Euro1,128.9 million, or 46.0 percent of total net
sales in the segment, in 2011. The increase in net sales in Europe of Euro54.4 million in
2012 as compared to the same period of 2011 constituted a 4.8 percent increase. Net sales
to third parties in our manufacturing and wholesale distribution segment in the United
States and Canada were USD 953.6 million and comprised 26.8 percent of our total net
sales in this segment for the twelve months of 2012, compared to USD 830.1 million, or
24.3 percent of total net sales in the segment, for the same period of 2011. The increase
in net sales in the United States and Canada was primarily due to a general increase in
consumer demand and to additional sales of the recently launched Coach line. In 2012, net
sales to third parties in our manufacturing and wholesale distribution segment in the rest
of the world were Euro847.6 million, comprising 30.6 percent of our total net sales in this
segment, compared to Euro731.1 million, or 29.8 percent of our net sales in this segment,
for the same period of 2011. The increase of Euro116.5 million, or 15.9 percent, in 2012
as compared to 2011, was due to the positive effect of currency fluctuations as well as an
increase in consumer demand, in particular in the emerging markets.
Cost of Sales. Cost of sales increased by Euro211.0 million, or 9.7 percent, to Euro2,379.1
million in 2012 from Euro2,168.1 million in 2011. As a percentage of net sales, cost of sales
decreased to 33.6 percent during 2012 as compared to 34.8 percent in 2011 due to efficiencies
achieved in the production cycle. In the twelve months of 2012, the average number of
frames produced daily in our facilities increased to approximately 275,500 as compared to