LensCrafters 2012 Annual Report Download - page 213
Download and view the complete annual report
Please find page 213 of the 2012 LensCrafters annual report below. You can navigate through the pages in the report by either clicking on the pages listed below, or by using the keyword search tool below to find specific information within the annual report.-
 1
1 -
2
-
3
-
4
-
5
-
6
-
7
-
8
-
9
-
10
-
11
-
12
-
13
-
14
-
15
-
16
-
17
-
18
-
19
-
20
-
21
-
22
-
23
-
24
-
25
-
26
-
27
-
28
-
29
-
30
-
31
-
32
-
33
-
34
-
35
-
36
-
37
-
38
-
39
-
40
-
41
-
42
-
43
-
44
-
45
-
46
-
47
-
48
-
49
-
50
-
51
-
52
-
53
-
54
-
55
-
56
-
57
-
58
-
59
-
60
-
61
-
62
-
63
-
64
-
65
-
66
-
67
-
68
-
69
-
70
-
71
-
72
-
73
-
74
-
75
-
76
-
77
-
78
-
79
-
80
-
81
-
82
-
83
-
84
-
85
-
86
-
87
-
88
-
89
-
90
-
91
-
92
-
93
-
94
-
95
-
96
-
97
-
98
-
99
-
100
-
101
-
102
-
103
-
104
-
105
-
106
-
107
-
108
-
109
-
110
-
111
-
112
-
113
-
114
-
115
-
116
-
117
-
118
-
119
-
120
-
121
-
122
-
123
-
124
-
125
-
126
-
127
-
128
-
129
-
130
-
131
-
132
-
133
-
134
-
135
-
136
-
137
-
138
-
139
-
140
-
141
-
142
-
143
-
144
-
145
-
146
-
147
-
148
-
149
-
150
-
151
-
152
-
153
-
154
-
155
-
156
-
157
-
158
-
159
-
160
-
161
-
162
-
163
-
164
-
165
-
166
-
167
-
168
-
169
-
170
-
171
-
172
-
173
-
174
-
175
-
176
-
177
-
178
-
179
-
180
-
181
-
182
-
183
-
184
-
185
-
186
-
187
-
188
-
189
-
190
-
191
-
192
-
193
-
194
-
195
-
196
-
197
-
198
-
199
-
200
-
201
-
202
-
 203
203 -
 204
204 -
 205
205 -
 206
206 -
 207
207 -
 208
208 -
 209
209 -
 210
210 -
 211
211 -
 212
212 -
 213
213 -
 214
214 -
 215
215 -
 216
216 -
 217
217 -
 218
218 -
 219
219 -
 220
220 -
 221
221 -
 222
222 -
 223
223 -
224
-
225
-
226
-
227
-
228
-
229
-
230
-
231
-
232
-
233
-
234
-
235
-
236
-
237
-
238
-
239
-
240
-
241
-
242
-
243
-
244
-
245
-
246
-
247
-
248
-
249
-
250
-
251
-
252
-
253
-
254
-
255
-
256
-
257
-
258
-
259
-
260
-
261
-
262
-
263
-
264
-
265
-
266
-
267
-
268
-
269
-
270
-
271
-
272
-
273
-
274
-
275
-
276
-
277
-
278
-
279
 |
 |

| 127 >CONSOLIDATED FINANCIAL STATEMENTS - NOTES
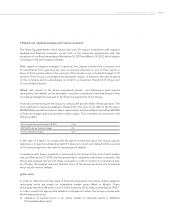
f) Default risk: negative pledges and financial covenants
The financing agreements of the Group (see note 21) require compliance with negative
pledges and financial covenants, as set forth in the respective agreements, with the
exception of our Bond issues dated November 10, 2010 and March 19, 2012, which require
compliance only with negative pledges.
With regard to negative pledges, in general, the clauses prohibit the Company and
its subsidiaries from granting any liens or security interests on any of their assets in
favor of third parties without the consent of the lenders over a threshold equal to 30
percent of the Group consolidated stockholders’ equity. In addition, the sale of assets
of the Company and its subsidiaries is limited to a maximum threshold of 30 percent
of consolidated assets.
Default with respect to the above mentioned clauses - and following a grace period
during which the default can be remedied - would be considered a material breach of the
contractual obligations pursuant to the financing agreement of the Group.
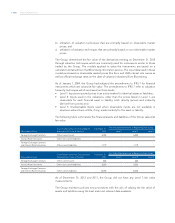
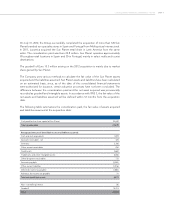
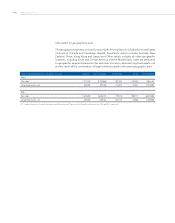
Financial covenants require the Group to comply with specific levels of financial ratios. The
most significant covenants establish a threshold for the ratio of net debt of the Group to
EBITDA (Earnings before interest, taxes, depreciation and amortization) as well as EBITDA
to financial charges and priority debt to share equity. The covenants are reported in the
following table:
Net Financial Position/Pro forma EBITDA <3.5 x
EBITDA/Pro forma financial charges >5 x
Priority Debt/Share Equity <20 x
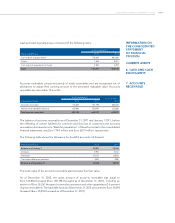
In the case of a failure to comply with the above mentioned ratios, the Group may be
called upon to pay the outstanding debt if it does not correct such default within a period
of 15 business days from the date of reporting such default.
Compliance with these covenants is monitored by the Group at the end of each quarter
and, as of December 31, 2012, the Group was fully in compliance with these covenants. The
Group also analyzes the trend of these covenants in order to monitor its compliance and,
as of today, the analysis indicates that the ratios of the Group are below the thresholds
which would result in default.
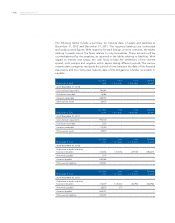
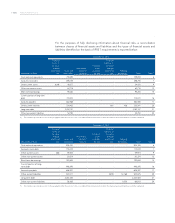
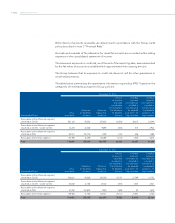
g) Fair value
In order to determine the fair value of financial instruments, the Group utilizes valuation
techniques which are based on observable market prices (Mark to Model). These
techniques therefore fall within Level 2 of the hierarchy of Fair Values identified by IFRS 7.
In order to select the appropriate valuation techniques to utilize, the Group complies with
the following hierarchy:
a) utilization of quoted prices in an active market for identical assets or liabilities
(Comparable Approach);