LensCrafters 2012 Annual Report Download - page 135
Download and view the complete annual report
Please find page 135 of the 2012 LensCrafters annual report below. You can navigate through the pages in the report by either clicking on the pages listed below, or by using the keyword search tool below to find specific information within the annual report.-
 1
1 -
2
-
3
-
4
-
5
-
6
-
7
-
8
-
9
-
10
-
11
-
12
-
13
-
14
-
15
-
16
-
17
-
18
-
19
-
20
-
21
-
22
-
23
-
24
-
25
-
26
-
27
-
28
-
29
-
30
-
31
-
32
-
33
-
34
-
35
-
36
-
37
-
38
-
39
-
40
-
41
-
42
-
43
-
44
-
45
-
46
-
47
-
48
-
49
-
50
-
51
-
52
-
53
-
54
-
55
-
56
-
57
-
58
-
59
-
60
-
61
-
62
-
63
-
64
-
65
-
66
-
67
-
68
-
69
-
70
-
71
-
72
-
73
-
74
-
75
-
76
-
77
-
78
-
79
-
80
-
81
-
82
-
83
-
84
-
85
-
86
-
87
-
88
-
89
-
90
-
91
-
92
-
93
-
94
-
95
-
96
-
97
-
98
-
99
-
100
-
101
-
102
-
103
-
104
-
105
-
106
-
107
-
108
-
109
-
110
-
111
-
112
-
113
-
114
-
115
-
116
-
117
-
118
-
119
-
120
-
121
-
122
-
123
-
124
-
 125
125 -
 126
126 -
 127
127 -
 128
128 -
 129
129 -
 130
130 -
 131
131 -
 132
132 -
 133
133 -
 134
134 -
 135
135 -
 136
136 -
 137
137 -
 138
138 -
 139
139 -
 140
140 -
 141
141 -
 142
142 -
 143
143 -
 144
144 -
 145
145 -
146
-
147
-
148
-
149
-
150
-
151
-
152
-
153
-
154
-
155
-
156
-
157
-
158
-
159
-
160
-
161
-
162
-
163
-
164
-
165
-
166
-
167
-
168
-
169
-
170
-
171
-
172
-
173
-
174
-
175
-
176
-
177
-
178
-
179
-
180
-
181
-
182
-
183
-
184
-
185
-
186
-
187
-
188
-
189
-
190
-
191
-
192
-
193
-
194
-
195
-
196
-
197
-
198
-
199
-
200
-
201
-
202
-
203
-
204
-
205
-
206
-
207
-
208
-
209
-
210
-
211
-
212
-
213
-
214
-
215
-
216
-
217
-
218
-
219
-
220
-
221
-
222
-
223
-
224
-
225
-
226
-
227
-
228
-
229
-
230
-
231
-
232
-
233
-
234
-
235
-
236
-
237
-
238
-
239
-
240
-
241
-
242
-
243
-
244
-
245
-
246
-
247
-
248
-
249
-
250
-
251
-
252
-
253
-
254
-
255
-
256
-
257
-
258
-
259
-
260
-
261
-
262
-
263
-
264
-
265
-
266
-
267
-
268
-
269
-
270
-
271
-
272
-
273
-
274
-
275
-
276
-
277
-
278
-
279
 |
 |

| 49 >MANAGEMENT REPORT - APPENDIX
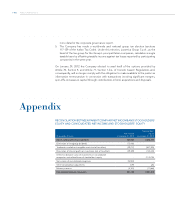
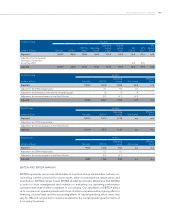
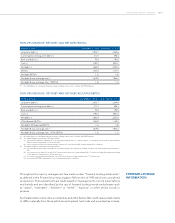
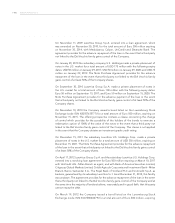
NON-IFRS MEASURE: FREE CASH FLOW
(millions of Euro) 4Q 2012
EBITDA (1) 258
working capital 258
Capex (140)
Operating cash flow 376
Financial charges (2) (28)
Taxes (113)
Other - net (3)
Free cash flow 232
(1) EBITDA is not an IFRS measure; please see table on the earlier page for a reconciliation of EBITDA to net income.
(2) Equals interest income minus interest expense.
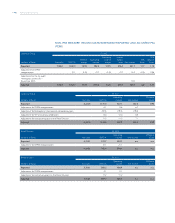
NET DEBT TO EBITDA RATIO
Net debt means the sum of bank overdrafts, current portion of long-term debt and
long-term debt, less cash. EBITDA represents net income before non-controlling interest,
taxes, other income/expense, depreciation and amortization.
The Group believes that EBITDA is useful to both management and investors in evaluating
the Group’s operating performance compared with that of other companies in its industry.
Our calculation of EBITDA allows us to compare our operating results with those of other
companies without giving effect to financing, income taxes and the accounting effects
of capital spending, which items may vary for different companies for reasons unrelated
to the overall operating performance of a company’s business. The ratio of net debt to
EBITDA is a measure used by management to assess the Group’s level of leverage, which
affects our ability to refinance our debt as it matures and incur additional indebtedness to
invest in new business opportunities.
The ratio also allows management to assess the cost of existing debt since it affects the
interest rates charged by the Company’s lenders.
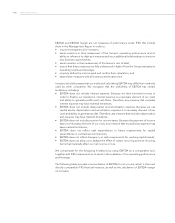
We include them in this Management Report in order to:
• improve transparency for investors;
• assist investors in their assessment of the Group’s operating performance and its
ability to refinance its debt as it matures and incur additional indebtedness to invest in
new business opportunities;
• assist investors in their assessment of the Group’s cost of debt;
• ensure that these measures are fully understood in light of how the Group evaluates its
operating results and leverage;
• properly define the metrics used and confirm their calculation; and
• share these measures with all investors at the same time.
Investors should be aware that Luxottica Group’s method of calculating EBITDA and the
ratio of net debt to EBITDA may differ from methods used by other companies.