LensCrafters 2012 Annual Report Download - page 108
Download and view the complete annual report
Please find page 108 of the 2012 LensCrafters annual report below. You can navigate through the pages in the report by either clicking on the pages listed below, or by using the keyword search tool below to find specific information within the annual report.-
 1
1 -
2
-
3
-
4
-
5
-
6
-
7
-
8
-
9
-
10
-
11
-
12
-
13
-
14
-
15
-
16
-
17
-
18
-
19
-
20
-
21
-
22
-
23
-
24
-
25
-
26
-
27
-
28
-
29
-
30
-
31
-
32
-
33
-
34
-
35
-
36
-
37
-
38
-
39
-
40
-
41
-
42
-
43
-
44
-
45
-
46
-
47
-
48
-
49
-
50
-
51
-
52
-
53
-
54
-
55
-
56
-
57
-
58
-
59
-
60
-
61
-
62
-
63
-
64
-
65
-
66
-
67
-
68
-
69
-
70
-
71
-
72
-
73
-
74
-
75
-
76
-
77
-
78
-
79
-
80
-
81
-
82
-
83
-
84
-
85
-
86
-
87
-
88
-
89
-
90
-
91
-
92
-
93
-
94
-
95
-
96
-
97
-
 98
98 -
 99
99 -
 100
100 -
 101
101 -
 102
102 -
 103
103 -
 104
104 -
 105
105 -
 106
106 -
 107
107 -
 108
108 -
 109
109 -
 110
110 -
 111
111 -
 112
112 -
 113
113 -
 114
114 -
 115
115 -
 116
116 -
 117
117 -
 118
118 -
119
-
120
-
121
-
122
-
123
-
124
-
125
-
126
-
127
-
128
-
129
-
130
-
131
-
132
-
133
-
134
-
135
-
136
-
137
-
138
-
139
-
140
-
141
-
142
-
143
-
144
-
145
-
146
-
147
-
148
-
149
-
150
-
151
-
152
-
153
-
154
-
155
-
156
-
157
-
158
-
159
-
160
-
161
-
162
-
163
-
164
-
165
-
166
-
167
-
168
-
169
-
170
-
171
-
172
-
173
-
174
-
175
-
176
-
177
-
178
-
179
-
180
-
181
-
182
-
183
-
184
-
185
-
186
-
187
-
188
-
189
-
190
-
191
-
192
-
193
-
194
-
195
-
196
-
197
-
198
-
199
-
200
-
201
-
202
-
203
-
204
-
205
-
206
-
207
-
208
-
209
-
210
-
211
-
212
-
213
-
214
-
215
-
216
-
217
-
218
-
219
-
220
-
221
-
222
-
223
-
224
-
225
-
226
-
227
-
228
-
229
-
230
-
231
-
232
-
233
-
234
-
235
-
236
-
237
-
238
-
239
-
240
-
241
-
242
-
243
-
244
-
245
-
246
-
247
-
248
-
249
-
250
-
251
-
252
-
253
-
254
-
255
-
256
-
257
-
258
-
259
-
260
-
261
-
262
-
263
-
264
-
265
-
266
-
267
-
268
-
269
-
270
-
271
-
272
-
273
-
274
-
275
-
276
-
277
-
278
-
279
 |
 |

ANNUAL REPORT 2012> 22 |
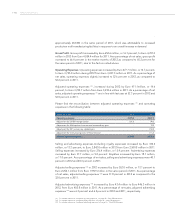
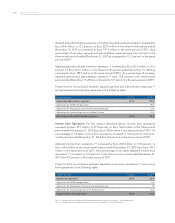
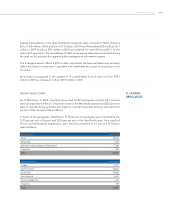
Please find the reconciliation between adjusted net income attributable to Luxottica
Group Stockholders (26) and net income attributable to Luxottica Group stockholders in
the following table:
(millions of Euro) 2012 2011
Net income 76.8 64.4
Adjustment for OPSM reorganization - 6.7
Adjustment for Multiopticas Internacional extraordinary gain - 1.9
Adjustment for restructuring costs in the Retail Division - (0.3)
Adjustment for tax audit related to Luxottica S.r.l. for fiscal year 2007 10.0 -
Adjusted net income 86.8 72.7
Basic and diluted earnings per share were Euro 0.16 in the three-month period ended
December 31, 2012 as compared to Euro0.14 in the same period of 2011.
Adjusted basic and diluted earnings per share (27) were Euro 0.19 and Euro 0.18 in the
three-month period ended December 31, 2012 respectively. In the same period of 2011
adjusted basic and diluted earnings per share were Euro0.16.
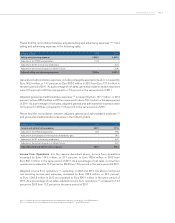
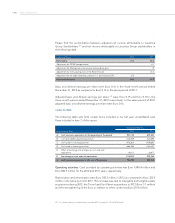
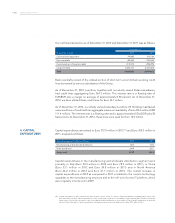
CASH FLOWS
The following table sets forth certain items included in our full year consolidated cash
flows included in Item 2 of this report.
As of December 31,
(thousands of Euro) 2012 2011
A) Cash and cash equivalents at the beginning of the period 905,100 679,852
B) Cash provided by operating activities 1,040,429 820,898
C) Cash used in investing activities (478,261) (459,880)
D) Cash used in financing activities (668,358) (164,447)
E) Effect of exchange rate changes on cash and cash
equivalents (8,817) 28,677
F) Net change in cash and cash equivalents (115,007) 225,248
G) Cash and cash equivalents at the end of the period 790,093 905,100
Operating activities. Cash provided by operating activities was Euro1,040.4 million and
Euro820.9 million for the 2012 and 2011 years, respectively.
Depreciation and amortization were Euro358.3 million in 2012 as compared to Euro323.9
million in the same period of 2011. This increase was due to intangible and tangible assets
acquisitions during 2012, the Tecnol and Sun Planet acquisitions in 2012 (Euro3.1 million)
and the strengthening of the Euroin relation to other currencies (Euro20.8 million).
(27) For a further discussion of adjusted basic and diluted EPS, see page 43 - “Non-IFRS Measures”.