LensCrafters 2012 Annual Report Download - page 69
Download and view the complete annual report
Please find page 69 of the 2012 LensCrafters annual report below. You can navigate through the pages in the report by either clicking on the pages listed below, or by using the keyword search tool below to find specific information within the annual report.-
 1
1 -
2
-
3
-
4
-
5
-
6
-
7
-
8
-
9
-
10
-
11
-
12
-
13
-
14
-
15
-
16
-
17
-
18
-
19
-
20
-
21
-
22
-
23
-
24
-
25
-
26
-
27
-
28
-
29
-
30
-
31
-
32
-
33
-
34
-
35
-
36
-
37
-
38
-
39
-
40
-
41
-
42
-
43
-
44
-
45
-
46
-
47
-
48
-
49
-
50
-
51
-
52
-
53
-
54
-
55
-
56
-
57
-
58
-
 59
59 -
 60
60 -
 61
61 -
 62
62 -
 63
63 -
 64
64 -
 65
65 -
 66
66 -
 67
67 -
 68
68 -
 69
69 -
 70
70 -
 71
71 -
 72
72 -
 73
73 -
 74
74 -
 75
75 -
 76
76 -
 77
77 -
 78
78 -
 79
79 -
80
-
81
-
82
-
83
-
84
-
85
-
86
-
87
-
88
-
89
-
90
-
91
-
92
-
93
-
94
-
95
-
96
-
97
-
98
-
99
-
100
-
101
-
102
-
103
-
104
-
105
-
106
-
107
-
108
-
109
-
110
-
111
-
112
-
113
-
114
-
115
-
116
-
117
-
118
-
119
-
120
-
121
-
122
-
123
-
124
-
125
-
126
-
127
-
128
-
129
-
130
-
131
-
132
-
133
-
134
-
135
-
136
-
137
-
138
-
139
-
140
-
141
-
142
-
143
-
144
-
145
-
146
-
147
-
148
-
149
-
150
-
151
-
152
-
153
-
154
-
155
-
156
-
157
-
158
-
159
-
160
-
161
-
162
-
163
-
164
-
165
-
166
-
167
-
168
-
169
-
170
-
171
-
172
-
173
-
174
-
175
-
176
-
177
-
178
-
179
-
180
-
181
-
182
-
183
-
184
-
185
-
186
-
187
-
188
-
189
-
190
-
191
-
192
-
193
-
194
-
195
-
196
-
197
-
198
-
199
-
200
-
201
-
202
-
203
-
204
-
205
-
206
-
207
-
208
-
209
-
210
-
211
-
212
-
213
-
214
-
215
-
216
-
217
-
218
-
219
-
220
-
221
-
222
-
223
-
224
-
225
-
226
-
227
-
228
-
229
-
230
-
231
-
232
-
233
-
234
-
235
-
236
-
237
-
238
-
239
-
240
-
241
-
242
-
243
-
244
-
245
-
246
-
247
-
248
-
249
-
250
-
251
-
252
-
253
-
254
-
255
-
256
-
257
-
258
-
259
-
260
-
261
-
262
-
263
-
264
-
265
-
266
-
267
-
268
-
269
-
270
-
271
-
272
-
273
-
274
-
275
-
276
-
277
-
278
-
279
 |
 |

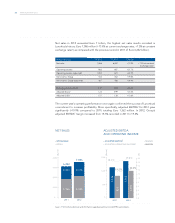
674 GROUP TRENDS IN 2012
See p. 77 for footnote disclosure and information regarding Luxottica’s non-IAS/IFRS reconciliations.
ADJUSTED OPERATING
INCOME BY DIVISION
› WHOLESALE
› RETAIL2
574
604
449
529
0
200
400
1,000
600
1,200
800
2011 2012
(Eur m)
NET INCOME ADJUSTED
AND ADJUSTED EPS
› NET INCOME2
› ADJUSTED EPS2
567456
0
100
200
300
400
500
600
2011 2012
1.22
0.99
0
0.25
0.50
0.75
1.00
1.25
(Eur m)
(Eur)
NET DEBT
› NET DEBT2
› ADJUSTED NET DEBT TO EBITDA2
1,662
2,032
2011 2012
0
300
600
900
1,200
1,500
1,800
2,100 1.8x
1.2x
(Eur m)
Growth in adjusted operating income2 for 2012 amounted to Euro 1,004 million, up 22.3%
compared to 2011. The Group’s adjusted operating margin2 increased from the 13.2%
recorded for 2011 to 14.2%.
Operating income of the wholesale division in 2012 amounted to Euro 604 million (+14.3%
over 2011), with an operating margin of 21.8% (+30 bps as compared with the previous
year).
In 2012, the retail division recorded adjusted operating income2 of Euro 574 million, up
28.0% from 2011, with an adjusted operating margin2 of 13.3% (+140 bps as compared with
the previous year).
Adjusted net income2 for the year amounted to Euro 567 million, up 24.4% from Euro 456
million for 2011, corresponding to adjusted Earnings per Share (EPS)2 of Euro 1.22.
In 2012, strict control over working capital enabled Luxottica to accumulate record free
cash flow2 in excess of Euro 700 million. As a result, net debt2 as of December 31, 2012
decreased further, falling to Euro 1,662 million (Euro 2,032 million at the end of 2011), and
the ratio of adjusted net debt to EBITDA2 was 1.2x as compared with 1.8x at the end of
2011.