LensCrafters 2012 Annual Report Download - page 98
Download and view the complete annual report
Please find page 98 of the 2012 LensCrafters annual report below. You can navigate through the pages in the report by either clicking on the pages listed below, or by using the keyword search tool below to find specific information within the annual report.-
 1
1 -
2
-
3
-
4
-
5
-
6
-
7
-
8
-
9
-
10
-
11
-
12
-
13
-
14
-
15
-
16
-
17
-
18
-
19
-
20
-
21
-
22
-
23
-
24
-
25
-
26
-
27
-
28
-
29
-
30
-
31
-
32
-
33
-
34
-
35
-
36
-
37
-
38
-
39
-
40
-
41
-
42
-
43
-
44
-
45
-
46
-
47
-
48
-
49
-
50
-
51
-
52
-
53
-
54
-
55
-
56
-
57
-
58
-
59
-
60
-
61
-
62
-
63
-
64
-
65
-
66
-
67
-
68
-
69
-
70
-
71
-
72
-
73
-
74
-
75
-
76
-
77
-
78
-
79
-
80
-
81
-
82
-
83
-
84
-
85
-
86
-
87
-
 88
88 -
 89
89 -
 90
90 -
 91
91 -
 92
92 -
 93
93 -
 94
94 -
 95
95 -
 96
96 -
 97
97 -
 98
98 -
 99
99 -
 100
100 -
 101
101 -
 102
102 -
 103
103 -
 104
104 -
 105
105 -
 106
106 -
 107
107 -
 108
108 -
109
-
110
-
111
-
112
-
113
-
114
-
115
-
116
-
117
-
118
-
119
-
120
-
121
-
122
-
123
-
124
-
125
-
126
-
127
-
128
-
129
-
130
-
131
-
132
-
133
-
134
-
135
-
136
-
137
-
138
-
139
-
140
-
141
-
142
-
143
-
144
-
145
-
146
-
147
-
148
-
149
-
150
-
151
-
152
-
153
-
154
-
155
-
156
-
157
-
158
-
159
-
160
-
161
-
162
-
163
-
164
-
165
-
166
-
167
-
168
-
169
-
170
-
171
-
172
-
173
-
174
-
175
-
176
-
177
-
178
-
179
-
180
-
181
-
182
-
183
-
184
-
185
-
186
-
187
-
188
-
189
-
190
-
191
-
192
-
193
-
194
-
195
-
196
-
197
-
198
-
199
-
200
-
201
-
202
-
203
-
204
-
205
-
206
-
207
-
208
-
209
-
210
-
211
-
212
-
213
-
214
-
215
-
216
-
217
-
218
-
219
-
220
-
221
-
222
-
223
-
224
-
225
-
226
-
227
-
228
-
229
-
230
-
231
-
232
-
233
-
234
-
235
-
236
-
237
-
238
-
239
-
240
-
241
-
242
-
243
-
244
-
245
-
246
-
247
-
248
-
249
-
250
-
251
-
252
-
253
-
254
-
255
-
256
-
257
-
258
-
259
-
260
-
261
-
262
-
263
-
264
-
265
-
266
-
267
-
268
-
269
-
270
-
271
-
272
-
273
-
274
-
275
-
276
-
277
-
278
-
279
 |
 |

ANNUAL REPORT 2012> 12 |
approximately 263,300 in the same period of 2011, which was attributable to increased
production in all manufacturing facilities in response to an overall increase in demand.
Gross Profit. Gross profit increased by Euro652.6 million, or 16.1 percent, to Euro4,707.0
million in 2012 from Euro4,054.4 million for 2011. As a percentage of net sales, gross profit
increased to 66.4 percent in the twelve months of 2012 as compared to 65.2 percent for
the same period of 2011, due to the factors noted above.
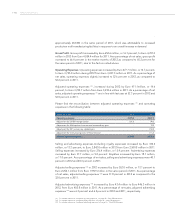
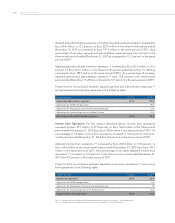
Operating Expenses. Operating expenses increased by Euro477.7 million, or 14.7 percent,
to Euro3,725.0 million during 2012 from Euro3,247.3 million in 2011. As a percentage of
net sales, operating expenses slightly increased to 52.6 percent in 2012, as compared to
52.2 percent in 2011.
Adjusted operating expenses (11), increased during 2012 by Euro 471.1million, or 14.6
percent, to Euro3,704.7 million from Euro3,233.6 million in 2011. As a percentage of net
sales, adjusted operating expenses (11) are in line with last year at 52.3 percent in 2012 and
52.0 percent in 2011.
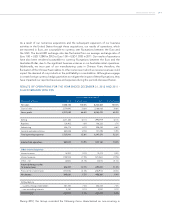
Please find the reconciliation between adjusted operating expenses (11) and operating
expenses in the following table:
(millions of Euro) 2012 2011
Operating expenses 3,725.0 3,247.3
Adjustment for OPSM reorganization (20.3) (9.6)
Adjustment for Multiopticas Internacional extraordinary gain - 19.0
Adjustment for 50th anniversary celebrations - (12.0)
Adjustment for restructuring costs in Retail Division - (11.2)
Adjusted operating expenses 3,704.7 3,233.6
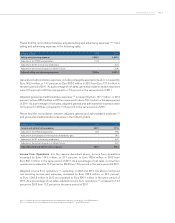
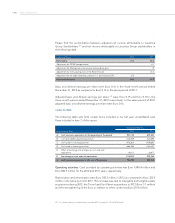
Selling and advertising expenses (including royalty expenses) increased by Euro 332.2
million, or 13.2 percent, to Euro2,842.0 million in 2012 from Euro2,509.8 million in 2011.
Selling expenses increased by Euro276.4 million, or 13.9 percent. Advertising expenses
increased by Euro37.7 million, or 9.2 percent. Royalties increased by Euro18.1 million,
or 17.0 percent. As a percentage of net sales, selling and advertising expenses were 40.1
percent in 2012 and 40.3 percent in 2011.
Adjusted selling expenses (12) in 2012 increased by Euro262.0 million, or 13.1 percent to
Euro2,254.1 million from Euro1,992.1million in the same period of 2011. As a percentage
of net sales, adjusted selling expenses (12) were 31.8 percent in 2012 as compared to the
32.0 percent in 2011.
Adjusted advertising expenses (13) increased by Euro43.4 million to Euro446.2 million in
2012, from Euro402.8 million in 2011. As a percentage of net sales, adjusted advertising
expenses (13) were 6.3 percent and 6.5 percent in 2012 and 2011, respectively.
(11) For a further discussion of adjusted operating expenses, see page 43 - “Non-IFRS Measures”.
(12) For a further discussion of adjusted selling expenses, see page 43 - “Non-IFRS Measures”.
(13) For a further discussion of adjusted advertising expenses, see page 43 - “Non-IFRS Measures.