LensCrafters 2012 Annual Report Download - page 265
Download and view the complete annual report
Please find page 265 of the 2012 LensCrafters annual report below. You can navigate through the pages in the report by either clicking on the pages listed below, or by using the keyword search tool below to find specific information within the annual report.-
 1
1 -
2
-
3
-
4
-
5
-
6
-
7
-
8
-
9
-
10
-
11
-
12
-
13
-
14
-
15
-
16
-
17
-
18
-
19
-
20
-
21
-
22
-
23
-
24
-
25
-
26
-
27
-
28
-
29
-
30
-
31
-
32
-
33
-
34
-
35
-
36
-
37
-
38
-
39
-
40
-
41
-
42
-
43
-
44
-
45
-
46
-
47
-
48
-
49
-
50
-
51
-
52
-
53
-
54
-
55
-
56
-
57
-
58
-
59
-
60
-
61
-
62
-
63
-
64
-
65
-
66
-
67
-
68
-
69
-
70
-
71
-
72
-
73
-
74
-
75
-
76
-
77
-
78
-
79
-
80
-
81
-
82
-
83
-
84
-
85
-
86
-
87
-
88
-
89
-
90
-
91
-
92
-
93
-
94
-
95
-
96
-
97
-
98
-
99
-
100
-
101
-
102
-
103
-
104
-
105
-
106
-
107
-
108
-
109
-
110
-
111
-
112
-
113
-
114
-
115
-
116
-
117
-
118
-
119
-
120
-
121
-
122
-
123
-
124
-
125
-
126
-
127
-
128
-
129
-
130
-
131
-
132
-
133
-
134
-
135
-
136
-
137
-
138
-
139
-
140
-
141
-
142
-
143
-
144
-
145
-
146
-
147
-
148
-
149
-
150
-
151
-
152
-
153
-
154
-
155
-
156
-
157
-
158
-
159
-
160
-
161
-
162
-
163
-
164
-
165
-
166
-
167
-
168
-
169
-
170
-
171
-
172
-
173
-
174
-
175
-
176
-
177
-
178
-
179
-
180
-
181
-
182
-
183
-
184
-
185
-
186
-
187
-
188
-
189
-
190
-
191
-
192
-
193
-
194
-
195
-
196
-
197
-
198
-
199
-
200
-
201
-
202
-
203
-
204
-
205
-
206
-
207
-
208
-
209
-
210
-
211
-
212
-
213
-
214
-
215
-
216
-
217
-
218
-
219
-
220
-
221
-
222
-
223
-
224
-
225
-
226
-
227
-
228
-
229
-
230
-
231
-
232
-
233
-
234
-
235
-
236
-
237
-
238
-
239
-
240
-
241
-
242
-
243
-
244
-
245
-
246
-
247
-
248
-
249
-
250
-
251
-
252
-
253
-
254
-
 255
255 -
 256
256 -
 257
257 -
 258
258 -
 259
259 -
 260
260 -
 261
261 -
 262
262 -
 263
263 -
 264
264 -
 265
265 -
 266
266 -
 267
267 -
 268
268 -
 269
269 -
 270
270 -
 271
271 -
 272
272 -
 273
273 -
 274
274 -
 275
275 -
276
-
277
-
278
-
279
 |
 |
| 179 >CONSOLIDATED FINANCIAL STATEMENTS - NOTES
The Group has recorded an expense for the ordinary stock option plans of Euro 10.8
million and Euro9.7 million in 2012 and 2011, respectively. For the 2009, 2010, 2011 and
2012 PSP plans, the Group recorded an expense of Euro30.5 million and Euro28.3 million
in 2012 and 2011, respectively. No expense on the 2008 PSP was recorded in 2010, 2009
and 2008, since the consolidated EPS targets were not met.
The stock plans outstanding as of December 31, 2012 are conditional upon satisfying the
service conditions. The 2004 and 2009 performance plans as well as all the PSP plans are
conditional upon satisfying service as well as performance conditions.
During 2012, the Company distributed an aggregate dividend to its stockholders of
Euro227.4 million equal to Euro0.49 per ordinary share. Dividends distributed to non-
controlling interests totaled Euro 2.3 million. During 2011, the Company distributed
an aggregate dividend to its stockholders of Euro202.5 million equal to Euro 0.44 per
ordinary share. Dividends distributed to non-controlling interests totaled Euro2.0 million.
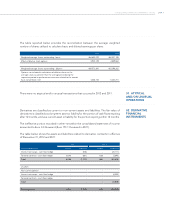
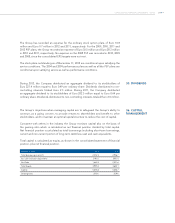
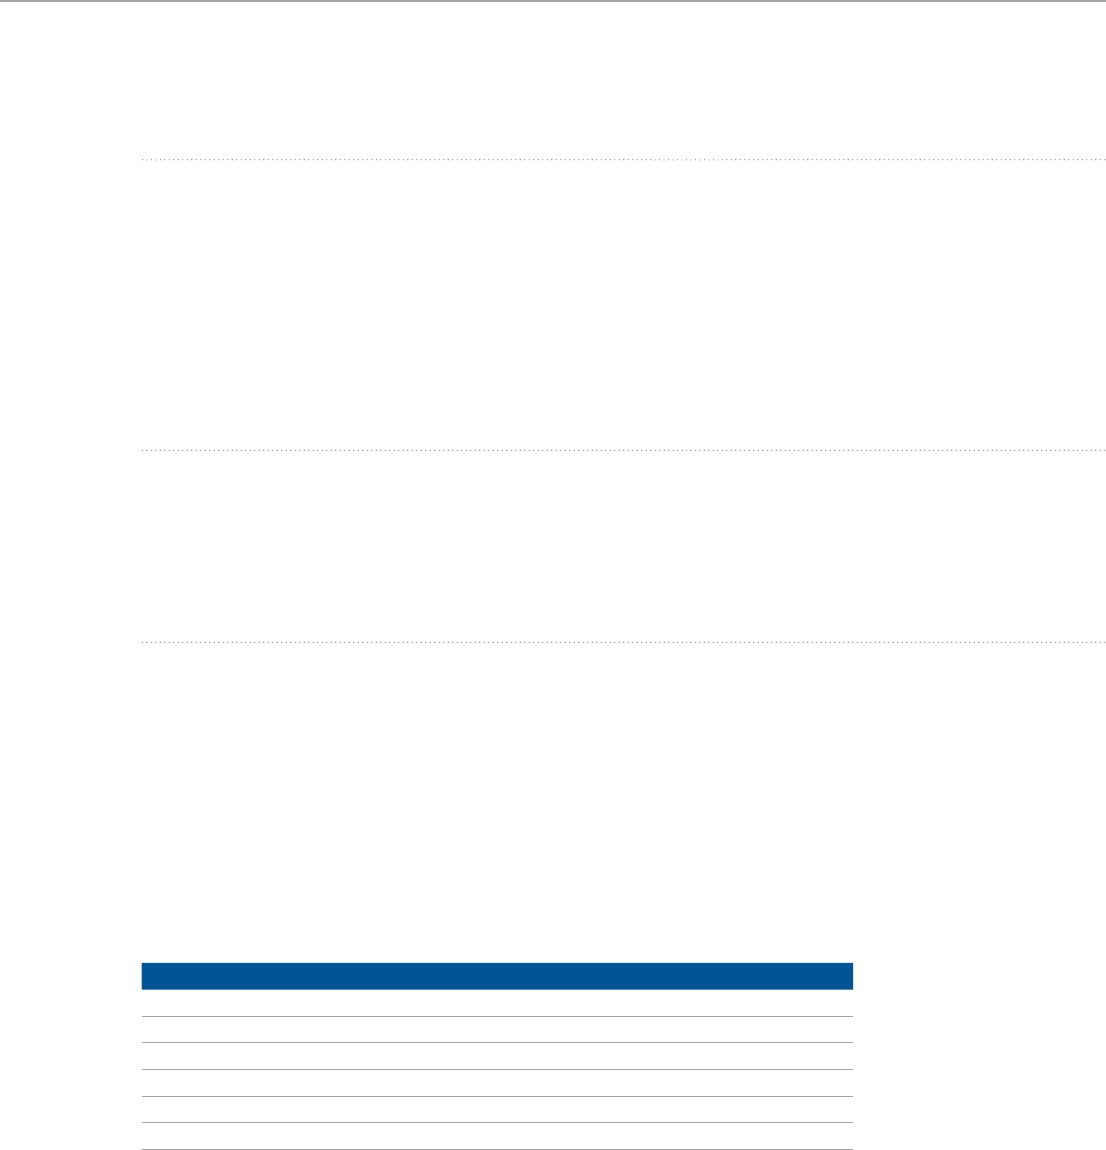
The Group’s objectives when managing capital are to safeguard the Group’s ability to
continue, as a going concern, to provide returns to shareholders and benefit to other
stockholders, and to maintain an optimal capital structure to reduce the cost of capital.
Consistent with others in the industry the Group monitors capital also on the basis of
the gearing ratio which is calculated as net financial position divided by total capital.
Net financial position is calculated as total borrowings (including short-term borrowings,
current and non-current portion of long-term debt) less cash and cash equivalents.
Total capital is calculated as equity, as shown in the consolidated statement of financial
position, plus net financial position.
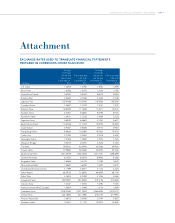
(millions of Euro) 2012 2011
Total borrowings (note 21) 2,452.5 2,936.7
less cash and cash equivalents (790.1) (905.1)
Net Debt 1,662.4 2,031.6
Total Equity 3,993.2 3,625.1
Capital 5,655.6 5,656.7
Gearing ratio 29.3% 35.9%
35. DIVIDENDS
36. CAPITAL
MANAGEMENT