LensCrafters 2012 Annual Report Download - page 109
Download and view the complete annual report
Please find page 109 of the 2012 LensCrafters annual report below. You can navigate through the pages in the report by either clicking on the pages listed below, or by using the keyword search tool below to find specific information within the annual report.-
 1
1 -
2
-
3
-
4
-
5
-
6
-
7
-
8
-
9
-
10
-
11
-
12
-
13
-
14
-
15
-
16
-
17
-
18
-
19
-
20
-
21
-
22
-
23
-
24
-
25
-
26
-
27
-
28
-
29
-
30
-
31
-
32
-
33
-
34
-
35
-
36
-
37
-
38
-
39
-
40
-
41
-
42
-
43
-
44
-
45
-
46
-
47
-
48
-
49
-
50
-
51
-
52
-
53
-
54
-
55
-
56
-
57
-
58
-
59
-
60
-
61
-
62
-
63
-
64
-
65
-
66
-
67
-
68
-
69
-
70
-
71
-
72
-
73
-
74
-
75
-
76
-
77
-
78
-
79
-
80
-
81
-
82
-
83
-
84
-
85
-
86
-
87
-
88
-
89
-
90
-
91
-
92
-
93
-
94
-
95
-
96
-
97
-
98
-
 99
99 -
 100
100 -
 101
101 -
 102
102 -
 103
103 -
 104
104 -
 105
105 -
 106
106 -
 107
107 -
 108
108 -
 109
109 -
 110
110 -
 111
111 -
 112
112 -
 113
113 -
 114
114 -
 115
115 -
 116
116 -
 117
117 -
 118
118 -
 119
119 -
120
-
121
-
122
-
123
-
124
-
125
-
126
-
127
-
128
-
129
-
130
-
131
-
132
-
133
-
134
-
135
-
136
-
137
-
138
-
139
-
140
-
141
-
142
-
143
-
144
-
145
-
146
-
147
-
148
-
149
-
150
-
151
-
152
-
153
-
154
-
155
-
156
-
157
-
158
-
159
-
160
-
161
-
162
-
163
-
164
-
165
-
166
-
167
-
168
-
169
-
170
-
171
-
172
-
173
-
174
-
175
-
176
-
177
-
178
-
179
-
180
-
181
-
182
-
183
-
184
-
185
-
186
-
187
-
188
-
189
-
190
-
191
-
192
-
193
-
194
-
195
-
196
-
197
-
198
-
199
-
200
-
201
-
202
-
203
-
204
-
205
-
206
-
207
-
208
-
209
-
210
-
211
-
212
-
213
-
214
-
215
-
216
-
217
-
218
-
219
-
220
-
221
-
222
-
223
-
224
-
225
-
226
-
227
-
228
-
229
-
230
-
231
-
232
-
233
-
234
-
235
-
236
-
237
-
238
-
239
-
240
-
241
-
242
-
243
-
244
-
245
-
246
-
247
-
248
-
249
-
250
-
251
-
252
-
253
-
254
-
255
-
256
-
257
-
258
-
259
-
260
-
261
-
262
-
263
-
264
-
265
-
266
-
267
-
268
-
269
-
270
-
271
-
272
-
273
-
274
-
275
-
276
-
277
-
278
-
279
 |
 |

| 23 >MANAGEMENT REPORT
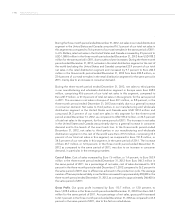
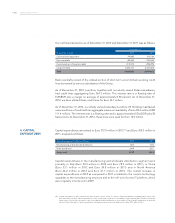
Cash used in accounts receivable was Euro34.6 million in 2012, compared to Euro16.4
million in the same period of 2011. This change was primarily due to an increase in sales
volume in 2012 as compared to the same period of 2011, partially offset by an improvement
in days sales outstanding ratio in 2012 as compared to 2011. Cash used in inventory was
Euro80.5 million in 2012 as compared to Euro30.5 million in the same period of 2011. The
change in inventory in 2012 is due to a strategic increase in wholesale division inventories
in relation to an implementation of SAP in our Italian manufacturing facilities at the
beginning of 2013. Cash generated by accounts payable was Euro61.5 million in 2012
compared to Euro51.1 million in the same period of 2011. This change is mainly due to
more favorable payment terms agreed during 2011. Cash generated/(used) in other assets
and liabilities was Euro39.4 million and Euro(14,0) million in 2012 and 2011 respectively.
This change is mainly due to the increase in personnel liabilities in the North America retail
division (Euro18.4 million) for the timing of salary payment to store personnel. Income
taxes paid were Euro265.7 million in 2012 as compared to Euro228.2 million in the same
period of 2011. This change was mainly due to the timing of tax payments made by the
Group in the different jurisdictions. Interest paid was Euro120.8 million and Euro122.5
million in 2012 and 2011, respectively.
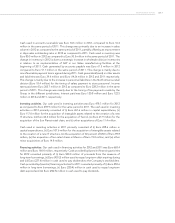
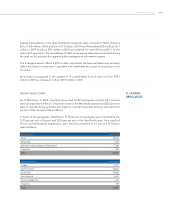
Investing activities. Our cash used in investing activities was Euro478.3 million for 2012
as compared to Euro459.9 million for the same period in 2011. The cash used in investing
activities in 2012 primarily consisted of (i) Euro261.6 million in capital expenditures, (ii)
Euro117.0 million for the acquisition of intangible assets related to the creation of a new
IT structure, (iii) Euro66.4 million for the acquisition of Tecnol, (iv) Euro21.9 million for the
acquisition of the Sun Planet retail chain, and (v) other acquisitions of Euro11.4 million.
Cash used in investing activities in 2011 primarily consisted of (i) Euro 228.6 million in
capital expenditures, (ii) Euro107.6 million for the acquisition of intangible assets related
to the creation of a new IT structure, (iii) the acquisition of 60 percent of MOI of Euro89.8
million, (iv) the acquisition of two retail chains in Mexico of Euro19.0 million, and (vi) other
minor acquisitions of Euro14.8 million.
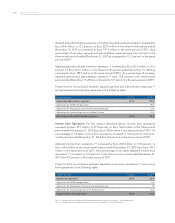
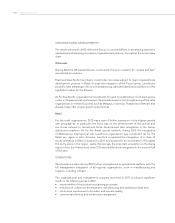
Financing activities. Our cash used in financing activities for 2012 and 2011 was Euro668.4
million and Euro164.4 million, respectively. Cash provided by/(used in) financing activities
for 2012 consisted primarily of (i) Euro 500.0 million of proceeds from the issuance of
long-term borrowings, (ii) Euro(935.2) million used to repay long-term debt expiring during
and (iii) Euro(227.4) million in cash used to pay dividends to the Company’s stockholders.
Cash provided by/(used in) financing activities for 2011 consisted primarily of (i) Euro250.6
million in long-term borrowings, (ii) Euro(230.4) million in cash used to repay long-term
debt expired and (iii) Euro(202.5) million in cash used to pay dividends.