LensCrafters 2012 Annual Report Download - page 111
Download and view the complete annual report
Please find page 111 of the 2012 LensCrafters annual report below. You can navigate through the pages in the report by either clicking on the pages listed below, or by using the keyword search tool below to find specific information within the annual report.-
 1
1 -
2
-
3
-
4
-
5
-
6
-
7
-
8
-
9
-
10
-
11
-
12
-
13
-
14
-
15
-
16
-
17
-
18
-
19
-
20
-
21
-
22
-
23
-
24
-
25
-
26
-
27
-
28
-
29
-
30
-
31
-
32
-
33
-
34
-
35
-
36
-
37
-
38
-
39
-
40
-
41
-
42
-
43
-
44
-
45
-
46
-
47
-
48
-
49
-
50
-
51
-
52
-
53
-
54
-
55
-
56
-
57
-
58
-
59
-
60
-
61
-
62
-
63
-
64
-
65
-
66
-
67
-
68
-
69
-
70
-
71
-
72
-
73
-
74
-
75
-
76
-
77
-
78
-
79
-
80
-
81
-
82
-
83
-
84
-
85
-
86
-
87
-
88
-
89
-
90
-
91
-
92
-
93
-
94
-
95
-
96
-
97
-
98
-
99
-
100
-
 101
101 -
 102
102 -
 103
103 -
 104
104 -
 105
105 -
 106
106 -
 107
107 -
 108
108 -
 109
109 -
 110
110 -
 111
111 -
 112
112 -
 113
113 -
 114
114 -
 115
115 -
 116
116 -
 117
117 -
 118
118 -
 119
119 -
 120
120 -
 121
121 -
122
-
123
-
124
-
125
-
126
-
127
-
128
-
129
-
130
-
131
-
132
-
133
-
134
-
135
-
136
-
137
-
138
-
139
-
140
-
141
-
142
-
143
-
144
-
145
-
146
-
147
-
148
-
149
-
150
-
151
-
152
-
153
-
154
-
155
-
156
-
157
-
158
-
159
-
160
-
161
-
162
-
163
-
164
-
165
-
166
-
167
-
168
-
169
-
170
-
171
-
172
-
173
-
174
-
175
-
176
-
177
-
178
-
179
-
180
-
181
-
182
-
183
-
184
-
185
-
186
-
187
-
188
-
189
-
190
-
191
-
192
-
193
-
194
-
195
-
196
-
197
-
198
-
199
-
200
-
201
-
202
-
203
-
204
-
205
-
206
-
207
-
208
-
209
-
210
-
211
-
212
-
213
-
214
-
215
-
216
-
217
-
218
-
219
-
220
-
221
-
222
-
223
-
224
-
225
-
226
-
227
-
228
-
229
-
230
-
231
-
232
-
233
-
234
-
235
-
236
-
237
-
238
-
239
-
240
-
241
-
242
-
243
-
244
-
245
-
246
-
247
-
248
-
249
-
250
-
251
-
252
-
253
-
254
-
255
-
256
-
257
-
258
-
259
-
260
-
261
-
262
-
263
-
264
-
265
-
266
-
267
-
268
-
269
-
270
-
271
-
272
-
273
-
274
-
275
-
276
-
277
-
278
-
279
 |
 |

| 25 >MANAGEMENT REPORT
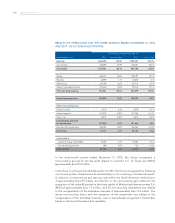
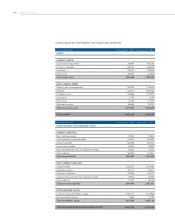
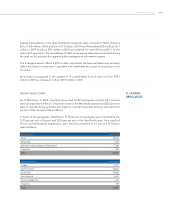
As of December 31, 2012, total assets increased by Euro67.9 million to Euro8,442.2 million,
compared to Euro8,374.3 million as of December 31, 2011.
In 2012, non-current assets increased by Euro94.7 million, due to increases in tangible
assets of Euro 33.0 million, to increases in intangible assets (including goodwill)
of Euro 53.0 million, to increases in investments of Euro 3.0 million, to increases in
deferred tax assets of Euro16.0 million, partially offset by a decrease of other assets
of Euro10.2 million.
The increase in intangible assets was primarily due to 2012 additions of Euro 117.0
million and to current year business acquisitions of Euro152.1 million, partially offset by
depreciation of Euro145.3 million and the negative effects of foreign currency fluctuations
from December 2011 to December 2012 of Euro63.2 million.
The increase in tangible assets was primarily due to 2012 currency fluctuation effects of
Euro13.8 million, additions of Euro269.4 million, including financial leases of Euro 7.9
million, current year business acquisitions of Euro12.5 million, which were partially offset
by the depreciation of Euro213.0 million and disposals of Euro29.0 million.
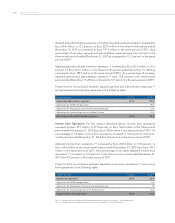
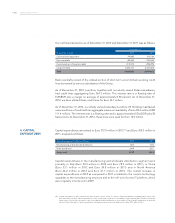
As of December 31, 2012, as compared to December 31, 2011:
• accounts receivable increased by Euro30.5 million, mainly due to the increase in net
sales during 2012, partially offset by the improvement in collection;
• inventory increased by Euro79.3 million. The growth is due to the acquisition of Tecnol
and to an increase in relation to an implementation of SAP in our Italian manufacturing
facilities at the beginning of 2013;
• other current assets decreased by Euro21.6 million. The reduction is mainly due to
utilization, in 2012, of the tax receivable balance as of December 31, 2011 (approximately
Euro12.4 million) and to the decrease in prepayments related to royalties by certain of
our Italian subsidiaries (approximately Euro11.6 million);
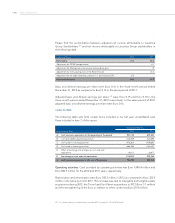
• accounts payable increased by Euro74.3 million. This increase is mainly due to better
payment conditions, which were negotiated by the Group in 2011;
• current taxes payable increased by Euro26.5 million mainly due to the timing of tax
payments made by the Group in various jurisdictions;
• current liabilities increased by Euro55.9 million mainly due to an increase in salary
payables related to North American retail store personnel (Euro18.4 million) and to
the increase of other liabilities in North America subsidiaries (Euro21.6 million);
• long-term provisions for risks increased by Euro 39.2 million mainly due to the
acquisition of Tecnol;
• other non-current liabilities decreased by Euro14.1 million mainly due to the expiration
date of interest rate derivatives (Euro8.3 million).