LensCrafters 2012 Annual Report Download - page 228
Download and view the complete annual report
Please find page 228 of the 2012 LensCrafters annual report below. You can navigate through the pages in the report by either clicking on the pages listed below, or by using the keyword search tool below to find specific information within the annual report.-
 1
1 -
2
-
3
-
4
-
5
-
6
-
7
-
8
-
9
-
10
-
11
-
12
-
13
-
14
-
15
-
16
-
17
-
18
-
19
-
20
-
21
-
22
-
23
-
24
-
25
-
26
-
27
-
28
-
29
-
30
-
31
-
32
-
33
-
34
-
35
-
36
-
37
-
38
-
39
-
40
-
41
-
42
-
43
-
44
-
45
-
46
-
47
-
48
-
49
-
50
-
51
-
52
-
53
-
54
-
55
-
56
-
57
-
58
-
59
-
60
-
61
-
62
-
63
-
64
-
65
-
66
-
67
-
68
-
69
-
70
-
71
-
72
-
73
-
74
-
75
-
76
-
77
-
78
-
79
-
80
-
81
-
82
-
83
-
84
-
85
-
86
-
87
-
88
-
89
-
90
-
91
-
92
-
93
-
94
-
95
-
96
-
97
-
98
-
99
-
100
-
101
-
102
-
103
-
104
-
105
-
106
-
107
-
108
-
109
-
110
-
111
-
112
-
113
-
114
-
115
-
116
-
117
-
118
-
119
-
120
-
121
-
122
-
123
-
124
-
125
-
126
-
127
-
128
-
129
-
130
-
131
-
132
-
133
-
134
-
135
-
136
-
137
-
138
-
139
-
140
-
141
-
142
-
143
-
144
-
145
-
146
-
147
-
148
-
149
-
150
-
151
-
152
-
153
-
154
-
155
-
156
-
157
-
158
-
159
-
160
-
161
-
162
-
163
-
164
-
165
-
166
-
167
-
168
-
169
-
170
-
171
-
172
-
173
-
174
-
175
-
176
-
177
-
178
-
179
-
180
-
181
-
182
-
183
-
184
-
185
-
186
-
187
-
188
-
189
-
190
-
191
-
192
-
193
-
194
-
195
-
196
-
197
-
198
-
199
-
200
-
201
-
202
-
203
-
204
-
205
-
206
-
207
-
208
-
209
-
210
-
211
-
212
-
213
-
214
-
215
-
216
-
217
-
 218
218 -
 219
219 -
 220
220 -
 221
221 -
 222
222 -
 223
223 -
 224
224 -
 225
225 -
 226
226 -
 227
227 -
 228
228 -
 229
229 -
 230
230 -
 231
231 -
 232
232 -
 233
233 -
 234
234 -
 235
235 -
 236
236 -
 237
237 -
 238
238 -
239
-
240
-
241
-
242
-
243
-
244
-
245
-
246
-
247
-
248
-
249
-
250
-
251
-
252
-
253
-
254
-
255
-
256
-
257
-
258
-
259
-
260
-
261
-
262
-
263
-
264
-
265
-
266
-
267
-
268
-
269
-
270
-
271
-
272
-
273
-
274
-
275
-
276
-
277
-
278
-
279
 |
 |

ANNUAL REPORT 2012> 142 |
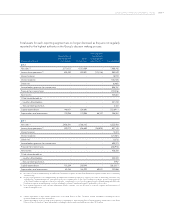
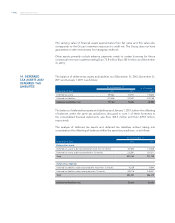
Other intangible assets includes internally generated assets of Euro57.4 million (Euro44.1
million as of December 2011).
The increase in intangible assets is mainly due to the implementation of a new IT
infrastructure started in 2008.
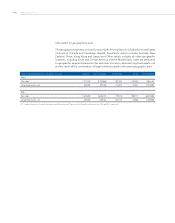
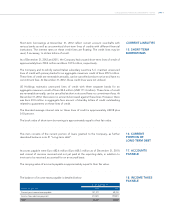
Impairment of goodwill
Pursuant to IAS 36 - Impairment of Assets, the Group has identified the following
four cash-generating units: Wholesale, Retail North America, Retail Asia-Pacific and
Retail Other. The cash-generating units reflect the distribution model adopted by
the Group.
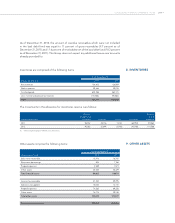
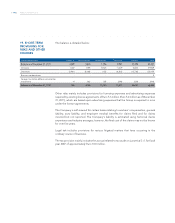
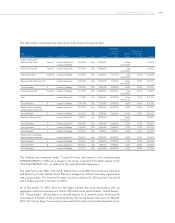
The value of goodwill allocated to each cash-generating unit is reported in the following
table:
(thousands of Euro) 2012 2011
Wholesale 1,203,749 1,134,742
Retail North America 1,388,263 1,409,353
Retail Asia-Pacific 376,414 381,387
Retail other 180,344 165,081
Total 3,148,770 3,090,563
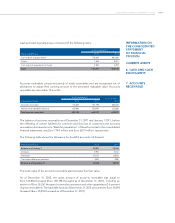
The information required by paragraph 134 of IAS 36 is provided below only for
the Wholesale and Retail North America cash-generating units, since the value of
goodwill allocated to these two units is a significant component of the Group’s total
goodwill.
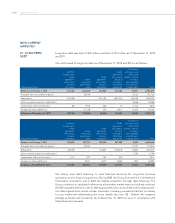
The recoverable amount of each cash-generating unit has been verified by comparing its
net assets carrying amounts to its value in use.
The main assumptions for determining the value in use are reported below and refer to
both cash-generating units:
• Growth rate: 2.0% (2.0% as at December 31, 2011);
• Discount rate: 7.8% (8.1% as at December 31, 2011).
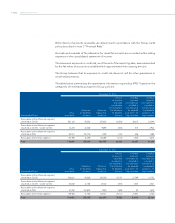
The discount rate has been determined on the basis of market information on the cost of
money and the specific risk of the industry (Weighted Average Cost of Capital, WACC).
In particular, the Group used a methodology to determine the discount rate which
was in line with that utilized in the previous year, considering the rates of return on
long-term government bonds and the average capital structure of a group of comparable
companies.
The recoverable amount of cash-generating units has been determined by utilizing
post-tax cash flow forecasts based on the Group’s 2013-2015 three-year plan, on the basis
of the results attained in previous years as well as management expectations - split by
geographic area - regarding future trends in the eyewear market for both the Wholesale