LensCrafters 2012 Annual Report Download - page 113
Download and view the complete annual report
Please find page 113 of the 2012 LensCrafters annual report below. You can navigate through the pages in the report by either clicking on the pages listed below, or by using the keyword search tool below to find specific information within the annual report.-
 1
1 -
2
-
3
-
4
-
5
-
6
-
7
-
8
-
9
-
10
-
11
-
12
-
13
-
14
-
15
-
16
-
17
-
18
-
19
-
20
-
21
-
22
-
23
-
24
-
25
-
26
-
27
-
28
-
29
-
30
-
31
-
32
-
33
-
34
-
35
-
36
-
37
-
38
-
39
-
40
-
41
-
42
-
43
-
44
-
45
-
46
-
47
-
48
-
49
-
50
-
51
-
52
-
53
-
54
-
55
-
56
-
57
-
58
-
59
-
60
-
61
-
62
-
63
-
64
-
65
-
66
-
67
-
68
-
69
-
70
-
71
-
72
-
73
-
74
-
75
-
76
-
77
-
78
-
79
-
80
-
81
-
82
-
83
-
84
-
85
-
86
-
87
-
88
-
89
-
90
-
91
-
92
-
93
-
94
-
95
-
96
-
97
-
98
-
99
-
100
-
101
-
102
-
 103
103 -
 104
104 -
 105
105 -
 106
106 -
 107
107 -
 108
108 -
 109
109 -
 110
110 -
 111
111 -
 112
112 -
 113
113 -
 114
114 -
 115
115 -
 116
116 -
 117
117 -
 118
118 -
 119
119 -
 120
120 -
 121
121 -
 122
122 -
 123
123 -
124
-
125
-
126
-
127
-
128
-
129
-
130
-
131
-
132
-
133
-
134
-
135
-
136
-
137
-
138
-
139
-
140
-
141
-
142
-
143
-
144
-
145
-
146
-
147
-
148
-
149
-
150
-
151
-
152
-
153
-
154
-
155
-
156
-
157
-
158
-
159
-
160
-
161
-
162
-
163
-
164
-
165
-
166
-
167
-
168
-
169
-
170
-
171
-
172
-
173
-
174
-
175
-
176
-
177
-
178
-
179
-
180
-
181
-
182
-
183
-
184
-
185
-
186
-
187
-
188
-
189
-
190
-
191
-
192
-
193
-
194
-
195
-
196
-
197
-
198
-
199
-
200
-
201
-
202
-
203
-
204
-
205
-
206
-
207
-
208
-
209
-
210
-
211
-
212
-
213
-
214
-
215
-
216
-
217
-
218
-
219
-
220
-
221
-
222
-
223
-
224
-
225
-
226
-
227
-
228
-
229
-
230
-
231
-
232
-
233
-
234
-
235
-
236
-
237
-
238
-
239
-
240
-
241
-
242
-
243
-
244
-
245
-
246
-
247
-
248
-
249
-
250
-
251
-
252
-
253
-
254
-
255
-
256
-
257
-
258
-
259
-
260
-
261
-
262
-
263
-
264
-
265
-
266
-
267
-
268
-
269
-
270
-
271
-
272
-
273
-
274
-
275
-
276
-
277
-
278
-
279
 |
 |

| 27 >MANAGEMENT REPORT
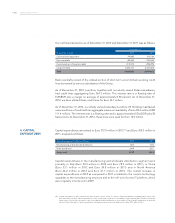
Capital expenditures in the retail distribution segment were primarily in North America
(Euro173.4 million in 2012 and Euro167.2 million in 2011) and Australia and China (Euro35.1
million in 2012 and Euro28.7 million in 2011) and related, for both 2012 and 2011, to the
opening of new stores, the remodeling of older stores whose leases were extended during
the year, and to projects for upgrading the management information system.
The Intangible assets of Euro4,494.5 million reported in the financial statements primarily
reflect the Group’s investment in goodwill and trademarks as a result of acquisitions over
the years.
Amortization recognized in the statement of consolidated income came to Euro 358.3
million in 2012 as compared to Euro323.9 million in 2011.
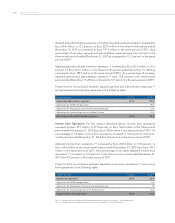
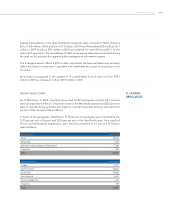
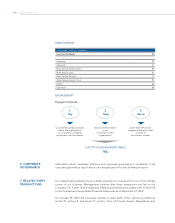
GROUP HEADCOUNT
As of December 31 2012, Luxottica Group had 70,307 employees of which 64.1 percent
were dedicated to the Retail, 10.4 percent were in the Wholesale segment and 25.0 percent
were in manufacturing activities and logistics. Central Corporate services represents 0.5
percent of the Group’s total workforce.
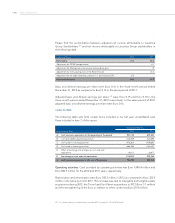
In terms of the geographic distribution, 57.8 percent of employees are in North America,
13.8 percent are in Europe and 20.8 percent are in the Asia-Pacific area. As a result of
Tecnol and Multiopticas acquisitions, Latin America increased to 6.3 percent of Group’s
total workforce.
Business area Headcount
Retail 45,036
Wholesale 7,344
Manufacturing and Logistics (Operations) 17,588
Corporate 339
Total 70,307
Geographic area Headcount
Europe 9,707
North America 40,667
Asia-Pacific 14,640
Latin America 4,422
Africa & Middle East 532
Corporate 339
Total 70,307
5. HUMAN
RESOURCES