LensCrafters 2012 Annual Report Download - page 229
Download and view the complete annual report
Please find page 229 of the 2012 LensCrafters annual report below. You can navigate through the pages in the report by either clicking on the pages listed below, or by using the keyword search tool below to find specific information within the annual report.-
 1
1 -
2
-
3
-
4
-
5
-
6
-
7
-
8
-
9
-
10
-
11
-
12
-
13
-
14
-
15
-
16
-
17
-
18
-
19
-
20
-
21
-
22
-
23
-
24
-
25
-
26
-
27
-
28
-
29
-
30
-
31
-
32
-
33
-
34
-
35
-
36
-
37
-
38
-
39
-
40
-
41
-
42
-
43
-
44
-
45
-
46
-
47
-
48
-
49
-
50
-
51
-
52
-
53
-
54
-
55
-
56
-
57
-
58
-
59
-
60
-
61
-
62
-
63
-
64
-
65
-
66
-
67
-
68
-
69
-
70
-
71
-
72
-
73
-
74
-
75
-
76
-
77
-
78
-
79
-
80
-
81
-
82
-
83
-
84
-
85
-
86
-
87
-
88
-
89
-
90
-
91
-
92
-
93
-
94
-
95
-
96
-
97
-
98
-
99
-
100
-
101
-
102
-
103
-
104
-
105
-
106
-
107
-
108
-
109
-
110
-
111
-
112
-
113
-
114
-
115
-
116
-
117
-
118
-
119
-
120
-
121
-
122
-
123
-
124
-
125
-
126
-
127
-
128
-
129
-
130
-
131
-
132
-
133
-
134
-
135
-
136
-
137
-
138
-
139
-
140
-
141
-
142
-
143
-
144
-
145
-
146
-
147
-
148
-
149
-
150
-
151
-
152
-
153
-
154
-
155
-
156
-
157
-
158
-
159
-
160
-
161
-
162
-
163
-
164
-
165
-
166
-
167
-
168
-
169
-
170
-
171
-
172
-
173
-
174
-
175
-
176
-
177
-
178
-
179
-
180
-
181
-
182
-
183
-
184
-
185
-
186
-
187
-
188
-
189
-
190
-
191
-
192
-
193
-
194
-
195
-
196
-
197
-
198
-
199
-
200
-
201
-
202
-
203
-
204
-
205
-
206
-
207
-
208
-
209
-
210
-
211
-
212
-
213
-
214
-
215
-
216
-
217
-
218
-
 219
219 -
 220
220 -
 221
221 -
 222
222 -
 223
223 -
 224
224 -
 225
225 -
 226
226 -
 227
227 -
 228
228 -
 229
229 -
 230
230 -
 231
231 -
 232
232 -
 233
233 -
 234
234 -
 235
235 -
 236
236 -
 237
237 -
 238
238 -
 239
239 -
240
-
241
-
242
-
243
-
244
-
245
-
246
-
247
-
248
-
249
-
250
-
251
-
252
-
253
-
254
-
255
-
256
-
257
-
258
-
259
-
260
-
261
-
262
-
263
-
264
-
265
-
266
-
267
-
268
-
269
-
270
-
271
-
272
-
273
-
274
-
275
-
276
-
277
-
278
-
279
 |
 |

| 143 >CONSOLIDATED FINANCIAL STATEMENTS - NOTES
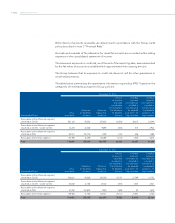
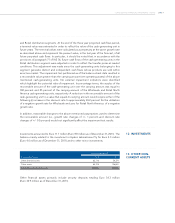
and Retail distribution segments. At the end of the three year projected cash flow period,
a terminal value was estimated in order to reflect the value of the cash-generating unit in
future years. The terminal values were calculated as a perpetuity at the same growth rate
as described above and represent the present value, in the last year of the forecast, of all
future perpetual cash flows. In particular, it should be noted that, in accordance with the
provisions of paragraph 71 of IAS 36, future cash flows of the cash-generating units in the
Retail distribution segment were adjusted in order to reflect the transfer prices at market
conditions. This adjustment was made since the cash-generating units belonging to this
segment generate distinct and independent cash flows whose products are sold within
an active market. The impairment test performed as of the balance sheet date resulted in
a recoverable value greater than the carrying amount (net operating assets) of the above
mentioned cash-generating units. No external impairment indicators were identified
which highlight the potential risks of impairment. In percentage terms, the surplus of the
recoverable amount of the cash-generating unit over the carrying amount was equal to
302 percent and 25 percent of the carrying amount of the Wholesale and Retail North
America cash-generating units, respectively. A reduction in the recoverable amount of the
cash-generating unit to a value that equals its carrying amount would require either of the
following (i) increase in the discount rate to approximately 24.2 percent for the utilization
of a negative growth rate for Wholesale and zero for Retail North America. of a negative
growth rate.
In addition, reasonable changes to the above mentioned assumptions used to determine
the recoverable amount (i.e., growth rate changes of +/- 1 percent and discount rate
changes of +/- 0.5 percent) would not significantly affect the impairment test results.
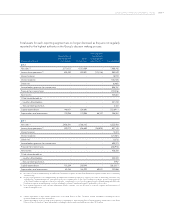
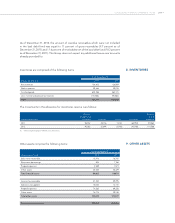
Investments amounted to Euro11.7 million (Euro8.8 million as of December 31, 2011). The
balance mainly related to the investment in Eyebiz Laboratories Pty for Euro4.3 million
(Euro4.0 million as of December 31, 2011) and to other minor investments.
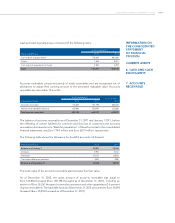
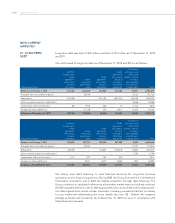
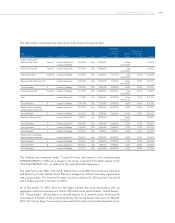
As of December 31 13. OTHER NON-
CURRENT ASSETS
(thousands of Euro) 2012 2011
Other financial assets 62,718 50,374
Other assets 84,318 106,881
Total other non-current assets 147,036 157,255
Other financial assets primarily include security deposits totaling Euro 34.3 million
(Euro32.9 million as of December 31, 2011).
12. INVESTMENTS