LensCrafters 2012 Annual Report Download - page 104
Download and view the complete annual report
Please find page 104 of the 2012 LensCrafters annual report below. You can navigate through the pages in the report by either clicking on the pages listed below, or by using the keyword search tool below to find specific information within the annual report.-
 1
1 -
2
-
3
-
4
-
5
-
6
-
7
-
8
-
9
-
10
-
11
-
12
-
13
-
14
-
15
-
16
-
17
-
18
-
19
-
20
-
21
-
22
-
23
-
24
-
25
-
26
-
27
-
28
-
29
-
30
-
31
-
32
-
33
-
34
-
35
-
36
-
37
-
38
-
39
-
40
-
41
-
42
-
43
-
44
-
45
-
46
-
47
-
48
-
49
-
50
-
51
-
52
-
53
-
54
-
55
-
56
-
57
-
58
-
59
-
60
-
61
-
62
-
63
-
64
-
65
-
66
-
67
-
68
-
69
-
70
-
71
-
72
-
73
-
74
-
75
-
76
-
77
-
78
-
79
-
80
-
81
-
82
-
83
-
84
-
85
-
86
-
87
-
88
-
89
-
90
-
91
-
92
-
93
-
 94
94 -
 95
95 -
 96
96 -
 97
97 -
 98
98 -
 99
99 -
 100
100 -
 101
101 -
 102
102 -
 103
103 -
 104
104 -
 105
105 -
 106
106 -
 107
107 -
 108
108 -
 109
109 -
 110
110 -
 111
111 -
 112
112 -
 113
113 -
 114
114 -
115
-
116
-
117
-
118
-
119
-
120
-
121
-
122
-
123
-
124
-
125
-
126
-
127
-
128
-
129
-
130
-
131
-
132
-
133
-
134
-
135
-
136
-
137
-
138
-
139
-
140
-
141
-
142
-
143
-
144
-
145
-
146
-
147
-
148
-
149
-
150
-
151
-
152
-
153
-
154
-
155
-
156
-
157
-
158
-
159
-
160
-
161
-
162
-
163
-
164
-
165
-
166
-
167
-
168
-
169
-
170
-
171
-
172
-
173
-
174
-
175
-
176
-
177
-
178
-
179
-
180
-
181
-
182
-
183
-
184
-
185
-
186
-
187
-
188
-
189
-
190
-
191
-
192
-
193
-
194
-
195
-
196
-
197
-
198
-
199
-
200
-
201
-
202
-
203
-
204
-
205
-
206
-
207
-
208
-
209
-
210
-
211
-
212
-
213
-
214
-
215
-
216
-
217
-
218
-
219
-
220
-
221
-
222
-
223
-
224
-
225
-
226
-
227
-
228
-
229
-
230
-
231
-
232
-
233
-
234
-
235
-
236
-
237
-
238
-
239
-
240
-
241
-
242
-
243
-
244
-
245
-
246
-
247
-
248
-
249
-
250
-
251
-
252
-
253
-
254
-
255
-
256
-
257
-
258
-
259
-
260
-
261
-
262
-
263
-
264
-
265
-
266
-
267
-
268
-
269
-
270
-
271
-
272
-
273
-
274
-
275
-
276
-
277
-
278
-
279
 |
 |

ANNUAL REPORT 2012> 18 |
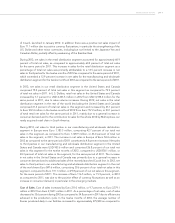
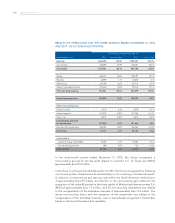
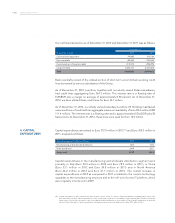
During the three-month period ended December 31, 2012, net sales in our retail distribution
segment in the United States and Canada comprised 76.1 percent of our total net sales in
this segment as compared to 76.6 percent of our total net sales in the same period of 2011.
In U.S. Dollars, retail net sales in the United States and Canada increased by 2.5 percent to
USD 1,008.0 million in the three-month period ended December 31, 2012 from USD 938.2
million for the same period in 2011, due to sales volume increases. During the three-month
period ended December 31, 2012, net sales in the retail distribution segment in the rest of
the world (excluding the United States and Canada) comprised 23.9 percent of our total
net sales in the retail distribution segment and increased by 9.7 percent to Euro244.5
million in the three-month period ended December 31, 2012 from Euro222.8 million, or
23.4 percent of our total net sales in the retail distribution segment for the same period in
2011, mainly due to an increase in consumer demand.
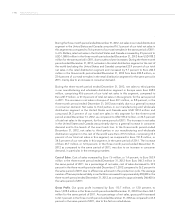
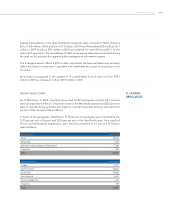
During the three-month period ended December 31, 2012, net sales to third parties
in our manufacturing and wholesale distribution segment in Europe were Euro248.0
million, comprising 40.6 percent of our total net sales in this segment, compared to
Euro227.9 million, or 41.0 percent of total net sales in the segment, for the same period
in 2011. The increase in net sales in Europe of Euro20.1 million, or 8.8 percent, in the
three-month period ended December 31, 2012 was mainly due to a general increase
in consumer demand. Net sales to third parties in our manufacturing and wholesale
distribution segment in the United States and Canada were USD 192.2 million and
comprised 24.2 percent of our total net sales in this segment for the three-month
period ended December 31, 2012, as compared to USD 183.2 million, or 24.5 percent
of total net sales in the segment, for the same period of 2011. The increase in net sales
in the United States and Canada was primarily due to a general increase in consumer
demand and to the launch of the new Coach line. In the three-month period ended
December 31, 2012, net sales to third parties in our manufacturing and wholesale
distribution segment in the rest of the world were Euro215.5 million, comprising 35.3
percent of our total net sales in this segment, as compared to Euro191.8 million, or
34.5 percent of our net sales in this segment, in the same period of 2011. The increase
of Euro23.7 million, or 12.4 percent, in the three-month period ended December 31,
2012 as compared to the same period of 2011, was due to an increase in consumer
demand, in particular in the emerging markets.
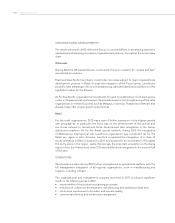
Cost of Sales. Cost of sales increased by Euro7.6 million, or 1.4 percent, to Euro553.9
million in the three-month period ended December 31, 2012 from Euro546.3 million in
the same period of 2011. As a percentage of net sales, cost of sales decreased to 33.9
percent in the three-month period ended December 31, 2012 compared to 36.2 percent in
the same period of 2011 due to efficiencies achieved in the production cycle. The average
number of frames produced daily in our facilities increased to approximately 283,000 in the
three-month period ended December 31, 2012, as compared to approximately 246,400 in
the same period of 2011.
Gross Profit. Our gross profit increased by Euro 115.7 million, or 12.0 percent, to
Euro1,078.4 million in the three-month period ended December 31, 2012 from Euro962.7
million for the same period of 2011. As a percentage of net sales, gross profit increased
to 66.1 percent in the three-month period ended December 31, 2012 as compared to 63.8
percent in the same period of 2011, due to the factors noted above.