LensCrafters 2010 Annual Report Download - page 9
Download and view the complete annual report
Please find page 9 of the 2010 LensCrafters annual report below. You can navigate through the pages in the report by either clicking on the pages listed below, or by using the keyword search tool below to find specific information within the annual report.-
 1
1 -
 2
2 -
 3
3 -
 4
4 -
 5
5 -
 6
6 -
 7
7 -
 8
8 -
 9
9 -
 10
10 -
 11
11 -
 12
12 -
 13
13 -
 14
14 -
 15
15 -
 16
16 -
 17
17 -
 18
18 -
 19
19 -
 20
20 -
21
-
22
-
23
-
24
-
25
-
26
-
27
-
28
-
29
-
30
-
31
-
32
-
33
-
34
-
35
-
36
-
37
-
38
-
39
-
40
-
41
-
42
-
43
-
44
-
45
-
46
-
47
-
48
-
49
-
50
-
51
-
52
-
53
-
54
-
55
-
56
-
57
-
58
-
59
-
60
-
61
-
62
-
63
-
64
-
65
-
66
-
67
-
68
-
69
-
70
-
71
-
72
-
73
-
74
-
75
-
76
-
77
-
78
-
79
-
80
-
81
-
82
-
83
-
84
-
85
-
86
-
87
-
88
-
89
-
90
-
91
-
92
-
93
-
94
-
95
-
96
-
97
-
98
-
99
-
100
-
101
-
102
-
103
-
104
-
105
-
106
-
107
-
108
-
109
-
110
-
111
-
112
-
113
-
114
-
115
-
116
-
117
-
118
-
119
-
120
-
121
-
122
-
123
-
124
-
125
-
126
-
127
-
128
-
129
-
130
-
131
-
132
-
133
-
134
-
135
-
136
-
137
-
138
-
139
-
140
-
141
-
142
-
143
-
144
-
145
-
146
-
147
-
148
-
149
-
150
-
151
-
152
-
153
-
154
-
155
-
156
-
157
-
158
-
159
-
160
-
161
-
162
-
163
-
164
-
165
-
166
-
167
-
168
-
169
-
170
-
171
-
172
-
173
-
174
-
175
-
176
-
177
-
178
-
179
-
180
-
181
-
182
-
183
-
184
-
185
-
186
-
187
-
188
-
189
-
190
-
191
-
192
-
193
-
194
-
195
-
196
-
197
-
198
-
199
-
200
-
201
-
202
-
203
-
204
-
205
-
206
-
207
-
208
 |
 |

|7 >
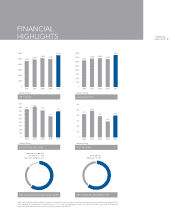
FINANCIAL
HIGHLIGHTS
FINANCIAL
HIGHLIGHTS
2009 20102006 2007
5,798
4,676 4,966 5,094
2008
5,202
0
1,000
2,000
3,000
4,000
5,000
6,000
millions of Euro
NET SALES
20102006 2007 2009
millions of Euro
712
769
833
571
2008
732
0
100
200
300
400
500
600
700
800
900
OPERATING INCOME
20102006 2007 2009
402
429
490
299
2008
390
0
100
200
300
400
500
600
millions of Euro
NET INCOME
20102006 2007 2009
3,808
3,251 3,388 3,332
2008
3,453
0
500
1,000
1,500
2,000
2,500
3,000
3,500
4,000
millions of Euro
GROSS PROFIT
61%
39%
Retail
Wholesale
North America
Asia-Pacific
Rest of the world
60%
13%
27%
NET SALES BY GEOGRAPHICAL AREA NET SALES BY DISTRIBUTION
In 2010, the Company determined that it would report its fi nancial results in accordance with the International Accounting and Reporting Standards (IAS/
IFRS) in all fi nancial communications, including reports to the Securities and Exchange Commission of the United States. As a result, all the fi nancial
fi gures provided in this Report have been prepared in accordance with IAS/IFRS.