LensCrafters 2010 Annual Report Download - page 69
Download and view the complete annual report
Please find page 69 of the 2010 LensCrafters annual report below. You can navigate through the pages in the report by either clicking on the pages listed below, or by using the keyword search tool below to find specific information within the annual report.-
 1
1 -
2
-
3
-
4
-
5
-
6
-
7
-
8
-
9
-
10
-
11
-
12
-
13
-
14
-
15
-
16
-
17
-
18
-
19
-
20
-
21
-
22
-
23
-
24
-
25
-
26
-
27
-
28
-
29
-
30
-
31
-
32
-
33
-
34
-
35
-
36
-
37
-
38
-
39
-
40
-
41
-
42
-
43
-
44
-
45
-
46
-
47
-
48
-
49
-
50
-
51
-
52
-
53
-
54
-
55
-
56
-
57
-
58
-
 59
59 -
 60
60 -
 61
61 -
 62
62 -
 63
63 -
 64
64 -
 65
65 -
 66
66 -
 67
67 -
 68
68 -
 69
69 -
 70
70 -
 71
71 -
 72
72 -
 73
73 -
 74
74 -
 75
75 -
 76
76 -
 77
77 -
 78
78 -
 79
79 -
80
-
81
-
82
-
83
-
84
-
85
-
86
-
87
-
88
-
89
-
90
-
91
-
92
-
93
-
94
-
95
-
96
-
97
-
98
-
99
-
100
-
101
-
102
-
103
-
104
-
105
-
106
-
107
-
108
-
109
-
110
-
111
-
112
-
113
-
114
-
115
-
116
-
117
-
118
-
119
-
120
-
121
-
122
-
123
-
124
-
125
-
126
-
127
-
128
-
129
-
130
-
131
-
132
-
133
-
134
-
135
-
136
-
137
-
138
-
139
-
140
-
141
-
142
-
143
-
144
-
145
-
146
-
147
-
148
-
149
-
150
-
151
-
152
-
153
-
154
-
155
-
156
-
157
-
158
-
159
-
160
-
161
-
162
-
163
-
164
-
165
-
166
-
167
-
168
-
169
-
170
-
171
-
172
-
173
-
174
-
175
-
176
-
177
-
178
-
179
-
180
-
181
-
182
-
183
-
184
-
185
-
186
-
187
-
188
-
189
-
190
-
191
-
192
-
193
-
194
-
195
-
196
-
197
-
198
-
199
-
200
-
201
-
202
-
203
-
204
-
205
-
206
-
207
-
208
 |
 |

APPENDIX | 67 >
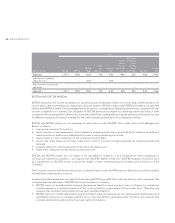
EBITDA does not include provision for income taxes. Because the payment of income taxes is a necessary element of •
our costs, any measure that excludes tax expense may have material limitations;
EBITDA does not reflect cash expenditures or future requirements for capital expenditures or contractual •
commitments;
EBITDA does not reflect changes in, or cash requirements for, working capital needs;•
EBITDA does not allow us to analyze the effect of certain recurring and non–recurring items that materially affect our •
net income or loss.
We compensate for the foregoing limitations by using EBITDA as a comparative tool, together with IAS/IFRS measurements,
to assist in the evaluation of our operating performance and leverage.
The following table provides a reconciliation of EBITDA to net income, which is the most directly comparable IAS/IFRS
financial measure, as well as the calculation of EBITDA margin on net sales:
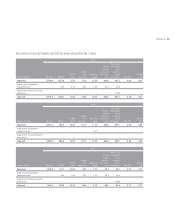
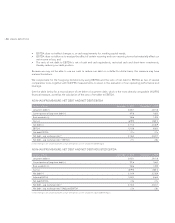
NON–IAS/IFRS MEASURE: EBITDA AND EBITDA MARGIN
(millions of Euro) 4Q10 4Q09 FY10 FY09
Net income/(loss) (+) 55.1 29.3 402.2 299.1
Discontinued operations (–) (19.9) – (19.9) –
Net income attributable to non–controlling interests (+) 0.9 0.8 5.1 5.8
Provision for income taxes (+) 32.0 14.6 218.2 159.9
Other (income)/expense (+) 2.3 2.2 8.1 4.1
Interest expense (+) 25.8 27.3 98.5 102.2
Depreciation & amortization (+) 76.2 71.2 301.6 285.4
EBITDA (=) 172.3 145.3 1,013.8 856.5
Net sales (/) 1,346.5 1,157.1 5,798.0 5,094.3
EBITDA margin (=) 12.8% 12.6% 17.5% 16.8%
NON–IAS/IFRS MEASURE: ADJUSTED EBITDA AND ADJUSTED EBITDA MARGIN
(millions of Euro) 4Q10 4Q09 FY10 FY09
Adjusted net income/(loss) (+) 55.6 29.3 402.7 299.1
Net income attributable to non–controlling interests (+) 0.9 0.8 5.1 5.8
Adjusted provision for income taxes (+) 32.0 14.6 218.2 159.9
Adjusted other (income)/expense (+) 2.3 2.2 8.1 4.1
Interest expense (+) 25.8 27.3 98.5 102.2
Adjusted depreciation & amortization (+) 76.2 71.2 301.6 285.4
Adjusted EBITDA (=) 192.8 145.3 1,034.2 856.5
Net sales (/) 1,346.5 1,157.1 5,798.0 5,094.3
Adjusted EBITDA margin (=) 14.3% 12.6% 17.8% 16.8%
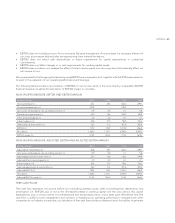
FREE CASH FLOW
Free cash flow represents net income before non–controlling interests, taxes, other income/expense, depreciation and
amortization (i.e. EBITDA) plus or minus the decrease/(increase) in working capital over the prior period, less capital
expenditures, plus or minus interest income/(expense) and extraordinary items, minus taxes paid. We believe that free
cash flow is useful to both management and investors in evaluating our operating performance compared with other
companies in our industry. In particular, our calculation of free cash flow provides a clearer picture of our ability to generate