LensCrafters 2010 Annual Report Download - page 151
Download and view the complete annual report
Please find page 151 of the 2010 LensCrafters annual report below. You can navigate through the pages in the report by either clicking on the pages listed below, or by using the keyword search tool below to find specific information within the annual report.-
 1
1 -
2
-
3
-
4
-
5
-
6
-
7
-
8
-
9
-
10
-
11
-
12
-
13
-
14
-
15
-
16
-
17
-
18
-
19
-
20
-
21
-
22
-
23
-
24
-
25
-
26
-
27
-
28
-
29
-
30
-
31
-
32
-
33
-
34
-
35
-
36
-
37
-
38
-
39
-
40
-
41
-
42
-
43
-
44
-
45
-
46
-
47
-
48
-
49
-
50
-
51
-
52
-
53
-
54
-
55
-
56
-
57
-
58
-
59
-
60
-
61
-
62
-
63
-
64
-
65
-
66
-
67
-
68
-
69
-
70
-
71
-
72
-
73
-
74
-
75
-
76
-
77
-
78
-
79
-
80
-
81
-
82
-
83
-
84
-
85
-
86
-
87
-
88
-
89
-
90
-
91
-
92
-
93
-
94
-
95
-
96
-
97
-
98
-
99
-
100
-
101
-
102
-
103
-
104
-
105
-
106
-
107
-
108
-
109
-
110
-
111
-
112
-
113
-
114
-
115
-
116
-
117
-
118
-
119
-
120
-
121
-
122
-
123
-
124
-
125
-
126
-
127
-
128
-
129
-
130
-
131
-
132
-
133
-
134
-
135
-
136
-
137
-
138
-
139
-
140
-
 141
141 -
 142
142 -
 143
143 -
 144
144 -
 145
145 -
 146
146 -
 147
147 -
 148
148 -
 149
149 -
 150
150 -
 151
151 -
 152
152 -
 153
153 -
 154
154 -
 155
155 -
 156
156 -
 157
157 -
 158
158 -
 159
159 -
 160
160 -
 161
161 -
162
-
163
-
164
-
165
-
166
-
167
-
168
-
169
-
170
-
171
-
172
-
173
-
174
-
175
-
176
-
177
-
178
-
179
-
180
-
181
-
182
-
183
-
184
-
185
-
186
-
187
-
188
-
189
-
190
-
191
-
192
-
193
-
194
-
195
-
196
-
197
-
198
-
199
-
200
-
201
-
202
-
203
-
204
-
205
-
206
-
207
-
208
 |
 |

|149 >
NOTES TO THE
CONSOLIDATED
FINANCIAL
STATEMENTS
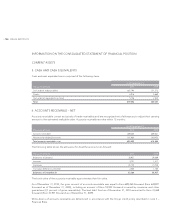
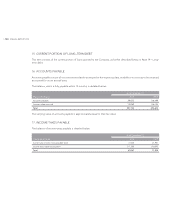
The increase in the income taxes receivable is mainly due to timing of payments made by certain U.S. subsidiaries to tax
authorities which are expected to be utilized during the first half of 2011.
Other assets include the short–term portion of advance payments made to certain designers for future contracted minimum
royalties totaling Euro 16.8 million as of December 31, 2010 (Euro 28,0 million as of December 31, 2009).
Prepaid expenses mainly relates to the timing of payments of monthly rental expenses incurred by the Group’s North
America and Asia–Pacific retail divisions.
The net book value of financial assets is approximately equal to their fair value and this value also corresponds to the
maximum exposure of the credit risk. The Group has no guarantees or other instruments to manage credit risk.
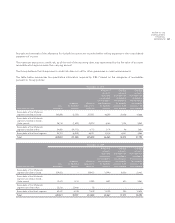
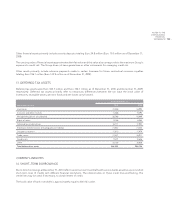
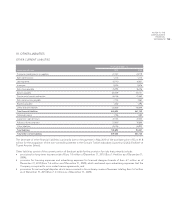
NON–CURRENT ASSETS
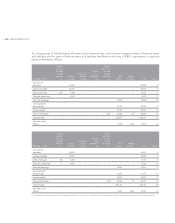
9. PROPERTY, PLANT AND EQUIPMENT – NET
Changes in items of property, plant and equipment are reported below:
(thousands of Euro)
Land and
buildings,
including
leasehold
improvements
Machinery and
equipment Aircraft
Other
equipment Total
As of January 1, 2009 494,538 348,618 34,127 293,697 1,170,980
Increases 33,709 65,633 – 101,067 200,409
Decreases (5,200) (2,628) (177) (3,623) (11,628)
Translation difference and other 1,487 38,900 – (47,782) (7,395)
Depreciation expense (53,015) (84,729) (1,593) (63,057) (202,394)
Balance as of December 31, 2009 471,519 365,794 32,357 280,302 1,149,972
Of which:
Historical cost 766,625 880,851 39,814 554,479 2,241,769
Accumulated depreciation (295,106) (515,057) (7,457) (274,177) (1,091,797)
Total 471,519 365,794 32,357 280,302 1,149,972
Increases 26,262 93,904 – 110,192 230,358
Decreases (1,031) (2,013) – (5,877) (8,921)
Translation difference and other 25,547 36,552 (148) 10,639 72,590
Depreciation expense (54,972) (127,014) (1,582) (31,302) (214,870)
Total balance as of December 31, 2010 467,325 367,223 30,627 363,954 1,229,130
Of which:
Historical cost 820,833 1,017,958 37,853 673,051 2,549,696
Accumulated depreciation (353,508) (650,735) (7,226) (309,097) (1,320,566)
Total 467,325 367,223 30,627 363,954 1,229,130
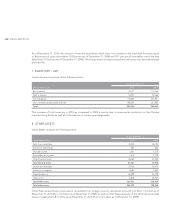
Of the total depreciation expense of Euro 214.9 million (Euro 202.4 million in 2009), Euro 60.4 million (Euro 55.5 million in
2009) is included in cost of sales. Euro 102.5 million (Euro 96.0 million in 2009),in salling expenses, Euro 5.1 million (Euro