LensCrafters 2010 Annual Report Download - page 47
Download and view the complete annual report
Please find page 47 of the 2010 LensCrafters annual report below. You can navigate through the pages in the report by either clicking on the pages listed below, or by using the keyword search tool below to find specific information within the annual report.-
 1
1 -
2
-
3
-
4
-
5
-
6
-
7
-
8
-
9
-
10
-
11
-
12
-
13
-
14
-
15
-
16
-
17
-
18
-
19
-
20
-
21
-
22
-
23
-
24
-
25
-
26
-
27
-
28
-
29
-
30
-
31
-
32
-
33
-
34
-
35
-
36
-
 37
37 -
 38
38 -
 39
39 -
 40
40 -
 41
41 -
 42
42 -
 43
43 -
 44
44 -
 45
45 -
 46
46 -
 47
47 -
 48
48 -
 49
49 -
 50
50 -
 51
51 -
 52
52 -
 53
53 -
 54
54 -
 55
55 -
 56
56 -
 57
57 -
58
-
59
-
60
-
61
-
62
-
63
-
64
-
65
-
66
-
67
-
68
-
69
-
70
-
71
-
72
-
73
-
74
-
75
-
76
-
77
-
78
-
79
-
80
-
81
-
82
-
83
-
84
-
85
-
86
-
87
-
88
-
89
-
90
-
91
-
92
-
93
-
94
-
95
-
96
-
97
-
98
-
99
-
100
-
101
-
102
-
103
-
104
-
105
-
106
-
107
-
108
-
109
-
110
-
111
-
112
-
113
-
114
-
115
-
116
-
117
-
118
-
119
-
120
-
121
-
122
-
123
-
124
-
125
-
126
-
127
-
128
-
129
-
130
-
131
-
132
-
133
-
134
-
135
-
136
-
137
-
138
-
139
-
140
-
141
-
142
-
143
-
144
-
145
-
146
-
147
-
148
-
149
-
150
-
151
-
152
-
153
-
154
-
155
-
156
-
157
-
158
-
159
-
160
-
161
-
162
-
163
-
164
-
165
-
166
-
167
-
168
-
169
-
170
-
171
-
172
-
173
-
174
-
175
-
176
-
177
-
178
-
179
-
180
-
181
-
182
-
183
-
184
-
185
-
186
-
187
-
188
-
189
-
190
-
191
-
192
-
193
-
194
-
195
-
196
-
197
-
198
-
199
-
200
-
201
-
202
-
203
-
204
-
205
-
206
-
207
-
208
 |
 |
|45 >
MANAGEMENT
REPORT
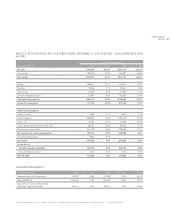
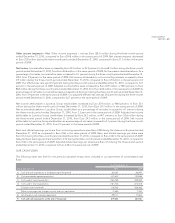
Net sales. Net sales increased by Euro 189.4 million, or 16.4 percent, to Euro 1,346.5 million during the three–month
period ended December 31, 2010, from Euro 1,157.1 million in the same period of 2009. Euro 64.6 million of such increase
was attributable to the increased sales in the manufacturing and wholesale distribution segment during the three–month
period ended December 31, 2010 as compared to the same period in 2009 and to the increase in net sales in the retail
distribution segment of Euro 124.8 million for the same period.
Net sales for the retail distribution segment increased by Euro 124.8 million, or 17.6 percent, to Euro 833.0 million
during the three–month period ended December 31, 2010, from Euro 708.2 million in the same period in 2009.
The increase in net sales for the period was partially attributable to an approximately 6.0 percent improvement
in comparable store sales. In particular, we saw an 8.3 percent increase in comparable store sales for the North
American retail operations, which was partially offset by a 6.0 percent decrease in comparable store sales for the
Australian/New Zealand retail operations. The positive effects from currency fluctuations between the Euro, which
is our reporting currency, and other currencies in which we conduct business, in particular the strengthening of the
U.S. dollar and the Australian dollar compared to the Euro, increased net sales in the retail distribution segment by
Euro 83.3 million.
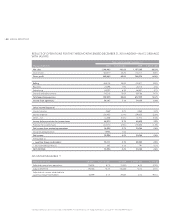
Net sales to third parties in the manufacturing and wholesale distribution segment increased by Euro 64.6 million, or
14.4 percent, to Euro 513.5 million during the three–month period ended December 31, 2010, from Euro 448.9 million
in the same period in 2009. This increase was mainly attributable to increased sales of most of our house brands, in
particular Ray–Ban and Oakley, and of some designer brands such as Chanel, Ralph Lauren and Tiffany. These sales
volume increases occurred in most of the geographic markets in which the Group operates. These positive effects were
further increased by positive currency fluctuations, in particular a strengthening of the U.S. dollar and Australian dollar
as well as other minor currencies, including but not limited to the Brazilian Real, the Japanese Yen and the South African
Rand compared to the Euro, which increased net sales to third parties in the manufacturing and wholesale distribution
segment by Euro 31.3 million.
During the three–month period ended December 31, 2010, net sales in the retail distribution segment accounted for
approximately 61.9 percent of total net sales as compared to approximately 61.2 percent of total net sales for the same
period in 2009. This increase in sales for the retail distribution segment as a percentage of total net sales in the three–month
period ended December 31, 2010 was primarily attributable to a 17.6 percent increase in net sales to the retail distribution
segment as compared to the same period of 2009, which exceeded an increase of 14.4 percent in our manufacturing and
wholesale distribution segment as compared to the same period of 2009.
During the three–month period ended December 31, 2010, net sales in our retail distribution segment in the United States
and Canada comprised 80.3 percent of our total net sales in this segment as compared to 78.8 percent of our total net
sales in the same period of 2009. In U.S. dollars, retail net sales in the United States and Canada increased by 9.1 percent
to US$ 912.7 million during the three–month period ended December 31, 2010, from US$ 836.5 million for the same period
in 2009, due to sales volume increases. During the three–month period ended December 31, 2010, net sales in the retail
distribution segment in the rest of the world (excluding the United States and Canada) comprised 19.7 percent of our total
net sales in the retail distribution segment and increased by 9.2 percent to Euro 163.7 million during the three–month
period ended December 31, 2010, from Euro 149.9 million, or 21.2 percent, for the same period in 2009, mainly due to
positive currency fluctuation effects.
During the three–month period ended December 31, 2010, net sales to third parties in our manufacturing and wholesale
distribution segment in Europe were Euro 221.7 million, comprising 43.2 percent of our total net sales in this segment,
compared to Euro 211.6 million, or 47.1 percent of total net sales in the segment, in the same period in 2009. The increase
in net sales in Europe of Euro 10.2 million, or 4.8 percent, during the three–month period ended December 31, 2010,
compared to the same period of 2009, was primarily due to a general increase in consumer demand. Net sales to third
parties in our manufacturing and wholesale distribution segment in the United States and Canada were US$ 157.1 million
and comprised 22.4 percent of our total net sales in this segment during the three–month period ended December 31,
2010, compared to US$ 144.7 million, or 21.4 percent of total net sales in the segment, in the same period of 2009. The