LensCrafters 2010 Annual Report Download - page 72
Download and view the complete annual report
Please find page 72 of the 2010 LensCrafters annual report below. You can navigate through the pages in the report by either clicking on the pages listed below, or by using the keyword search tool below to find specific information within the annual report.-
 1
1 -
2
-
3
-
4
-
5
-
6
-
7
-
8
-
9
-
10
-
11
-
12
-
13
-
14
-
15
-
16
-
17
-
18
-
19
-
20
-
21
-
22
-
23
-
24
-
25
-
26
-
27
-
28
-
29
-
30
-
31
-
32
-
33
-
34
-
35
-
36
-
37
-
38
-
39
-
40
-
41
-
42
-
43
-
44
-
45
-
46
-
47
-
48
-
49
-
50
-
51
-
52
-
53
-
54
-
55
-
56
-
57
-
58
-
59
-
60
-
61
-
 62
62 -
 63
63 -
 64
64 -
 65
65 -
 66
66 -
 67
67 -
 68
68 -
 69
69 -
 70
70 -
 71
71 -
 72
72 -
 73
73 -
 74
74 -
 75
75 -
 76
76 -
 77
77 -
 78
78 -
 79
79 -
 80
80 -
 81
81 -
 82
82 -
83
-
84
-
85
-
86
-
87
-
88
-
89
-
90
-
91
-
92
-
93
-
94
-
95
-
96
-
97
-
98
-
99
-
100
-
101
-
102
-
103
-
104
-
105
-
106
-
107
-
108
-
109
-
110
-
111
-
112
-
113
-
114
-
115
-
116
-
117
-
118
-
119
-
120
-
121
-
122
-
123
-
124
-
125
-
126
-
127
-
128
-
129
-
130
-
131
-
132
-
133
-
134
-
135
-
136
-
137
-
138
-
139
-
140
-
141
-
142
-
143
-
144
-
145
-
146
-
147
-
148
-
149
-
150
-
151
-
152
-
153
-
154
-
155
-
156
-
157
-
158
-
159
-
160
-
161
-
162
-
163
-
164
-
165
-
166
-
167
-
168
-
169
-
170
-
171
-
172
-
173
-
174
-
175
-
176
-
177
-
178
-
179
-
180
-
181
-
182
-
183
-
184
-
185
-
186
-
187
-
188
-
189
-
190
-
191
-
192
-
193
-
194
-
195
-
196
-
197
-
198
-
199
-
200
-
201
-
202
-
203
-
204
-
205
-
206
-
207
-
208
 |
 |

ANNUAL REPORT 2010> 70 |
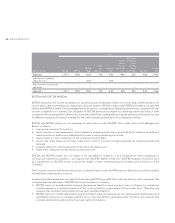
EBITDA does not reflect changes in, or cash requirements for, working capital needs;•
EBITDA does not allow us to analyze the effect of certain recurring and non–recurring items that materially affect our •
net income or loss; and
The ratio of net debt to EBITDA is net of cash and cash equivalents, restricted cash and short–term investments, •
thereby reducing our debt position.
Because we may not be able to use our cash to reduce our debt on a dollar–for–dollar basis, this measure may have
material limitations.
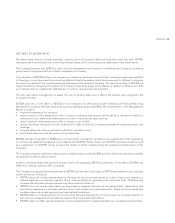
We compensate for the foregoing limitations by using EBITDA and the ratio of net debt to EBITDA as two of several
comparative tools, together with IAS/IFRS measurements, to assist in the evaluation of our operating performance and
leverage.
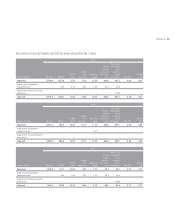
See the table below for a reconciliation of net debt to long–term debt, which is the most directly comparable IAS/IFRS
financial measure, as well as the calculation of the ratio of net debt to EBITDA.
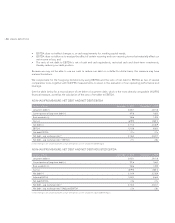
NON–IAS/IFRS MEASURE: NET DEBT AND NET DEBT/EBITDA
(millions of Euro) December 31, 2010 December 31, 2009
Long–term debt (+) 2,435.1 2,401.8
Current portion of long–term debt (+) 197.6 166.3
Bank overdrafts (+) 158.6 149.0
Cash (–) (679.9) (380.1)
Net debt (=) 2,111.4 2,336.9
EBITDA 1,013.8 856.5
Net debt/EBITDA 2.1x 2.7x
Net debt – avg. exchange rates (1) 2,116.2 2,381.7
Net debt – avg. exchange rates (1)/EBITDA 2.1x 2.8x
(1) Net debt fi gures are calculated using the average exchange rates used to calculate the EBITDA fi gures.
NON–IAS/IFRS MEASURE: NET DEBT AND NET DEBT/ADJUSTED EBITDA
(millions of Euro) December 31, 2010 December 31, 2009
Long–term debt (+) 2,435.1 2,401.8
Current portion of long–term debt (+) 197.6 166.3
Bank overdrafts (+) 158.6 149.0
Cash (–) (679.9) (380.1)
Net debt (=) 2,114.4 2,336.9
Adjusted EBITDA 1,034.2 856.5
Net debt/EBITDA 2.0x 2.7x
Net debt – avg. exchange rates (1) 2,116.2 2,381.7
Net debt – avg. exchange rates (1)/Adjusted EBITDA 2.0x 2.8x
(1) Net debt fi gures are calculated using the average exchange rates used to calculate the adjusted EBITDA fi gures.