LensCrafters 2010 Annual Report Download - page 166
Download and view the complete annual report
Please find page 166 of the 2010 LensCrafters annual report below. You can navigate through the pages in the report by either clicking on the pages listed below, or by using the keyword search tool below to find specific information within the annual report.-
 1
1 -
2
-
3
-
4
-
5
-
6
-
7
-
8
-
9
-
10
-
11
-
12
-
13
-
14
-
15
-
16
-
17
-
18
-
19
-
20
-
21
-
22
-
23
-
24
-
25
-
26
-
27
-
28
-
29
-
30
-
31
-
32
-
33
-
34
-
35
-
36
-
37
-
38
-
39
-
40
-
41
-
42
-
43
-
44
-
45
-
46
-
47
-
48
-
49
-
50
-
51
-
52
-
53
-
54
-
55
-
56
-
57
-
58
-
59
-
60
-
61
-
62
-
63
-
64
-
65
-
66
-
67
-
68
-
69
-
70
-
71
-
72
-
73
-
74
-
75
-
76
-
77
-
78
-
79
-
80
-
81
-
82
-
83
-
84
-
85
-
86
-
87
-
88
-
89
-
90
-
91
-
92
-
93
-
94
-
95
-
96
-
97
-
98
-
99
-
100
-
101
-
102
-
103
-
104
-
105
-
106
-
107
-
108
-
109
-
110
-
111
-
112
-
113
-
114
-
115
-
116
-
117
-
118
-
119
-
120
-
121
-
122
-
123
-
124
-
125
-
126
-
127
-
128
-
129
-
130
-
131
-
132
-
133
-
134
-
135
-
136
-
137
-
138
-
139
-
140
-
141
-
142
-
143
-
144
-
145
-
146
-
147
-
148
-
149
-
150
-
151
-
152
-
153
-
154
-
155
-
 156
156 -
 157
157 -
 158
158 -
 159
159 -
 160
160 -
 161
161 -
 162
162 -
 163
163 -
 164
164 -
 165
165 -
 166
166 -
 167
167 -
 168
168 -
 169
169 -
 170
170 -
 171
171 -
 172
172 -
 173
173 -
 174
174 -
 175
175 -
 176
176 -
177
-
178
-
179
-
180
-
181
-
182
-
183
-
184
-
185
-
186
-
187
-
188
-
189
-
190
-
191
-
192
-
193
-
194
-
195
-
196
-
197
-
198
-
199
-
200
-
201
-
202
-
203
-
204
-
205
-
206
-
207
-
208
 |
 |

ANNUAL REPORT 2010> 164 |
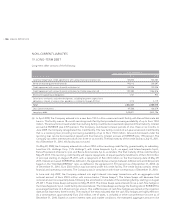
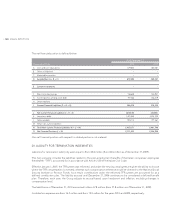
Amounts to be recognized in the statement of financial position and profit or loss along with actual return on assets were
as follows:
(thousands of Euro)
Pension Plan SERPs
2010 2009 2010 2009
Amounts recognized in the statement of financial position:
Liabilities:
Present value of the obligation 409,316 334,015 11,340 11,299
Fair value of plan assets 314,501 238,168 – –
Liability recognized in statement of financial position 94,815 95,847 11,340 11,299
Accumulated other comprehensive income:
Net gain/(loss), beginning of year (63,659) (87,429) (2,627) (3,849)
Asset gain/(loss) 14,462 23,790 – –
Liability experience gain/(loss) 1,744 (1,761) 421 1,228
Liability assumption change gain/(loss) (28,161) (191) (875) (86)
Translation difference (4,527) 1,932 (187) 80
Accumulated other comprehensive income, end of year (80,141) (63,659) (3,268) (2,627)
Service cost 18,640 18,443 367 466
Interest cost 21,700 19,476 628 633
Expected return on plan assets (21,185) (15,204) – –
Settlement loss – – 81 –
Expense recognized in profit or loss 19,156 22,715 1,076 1,129
Actual return on assets:
Expected return on assets 21,185 15,205 – –
Actuarial gain/(loss) on plan assets 14,462 23,790 – –
Actual return on assets 35,646 38,995 – –
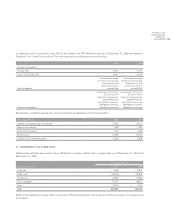
During 2010, the Lux SERP plan settled a portion of its benefit obligations through lump sum cash payments to certain
plan participants. As a result of this action, the projected benefit obligation was re–measured as of July 1, 2010. US
Holdings recognized an actuarial loss of Euro 81 thousand in earnings at the time of re–measurement.
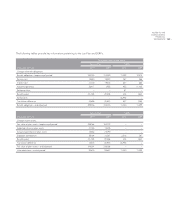
The following tables show the main assumptions used to determine the period benefit cost and the benefit obligation.
Lux Plan SERPs
2010 2009 2010 2009
Weighted–average assumptions used to determine benefit
obligations:
Discount Rate 5,50% 6,15% 5,50% 6,15%
Rate of compensation increase 5% – 3% – 2% 4% – 3% – 1% 5% – 3% – 2% 4% – 3% – 1%
Expected long–term return on plan assets 8,00% 8,00% n.a. n.a.
Pension Plan
2010 2009
Weighted–average assumptions used to determine net periodic benefit cost:
Discount rate 5.50% 6.15%
Expected long–term return on plan assets 8.00% 8.00%
Rate of compensation increase 5% – 3% – 2% 4% – 3% – 1%
Mortality table RP–2000 RP–2000