LensCrafters 2010 Annual Report Download - page 143
Download and view the complete annual report
Please find page 143 of the 2010 LensCrafters annual report below. You can navigate through the pages in the report by either clicking on the pages listed below, or by using the keyword search tool below to find specific information within the annual report.-
 1
1 -
2
-
3
-
4
-
5
-
6
-
7
-
8
-
9
-
10
-
11
-
12
-
13
-
14
-
15
-
16
-
17
-
18
-
19
-
20
-
21
-
22
-
23
-
24
-
25
-
26
-
27
-
28
-
29
-
30
-
31
-
32
-
33
-
34
-
35
-
36
-
37
-
38
-
39
-
40
-
41
-
42
-
43
-
44
-
45
-
46
-
47
-
48
-
49
-
50
-
51
-
52
-
53
-
54
-
55
-
56
-
57
-
58
-
59
-
60
-
61
-
62
-
63
-
64
-
65
-
66
-
67
-
68
-
69
-
70
-
71
-
72
-
73
-
74
-
75
-
76
-
77
-
78
-
79
-
80
-
81
-
82
-
83
-
84
-
85
-
86
-
87
-
88
-
89
-
90
-
91
-
92
-
93
-
94
-
95
-
96
-
97
-
98
-
99
-
100
-
101
-
102
-
103
-
104
-
105
-
106
-
107
-
108
-
109
-
110
-
111
-
112
-
113
-
114
-
115
-
116
-
117
-
118
-
119
-
120
-
121
-
122
-
123
-
124
-
125
-
126
-
127
-
128
-
129
-
130
-
131
-
132
-
 133
133 -
 134
134 -
 135
135 -
 136
136 -
 137
137 -
 138
138 -
 139
139 -
 140
140 -
 141
141 -
 142
142 -
 143
143 -
 144
144 -
 145
145 -
 146
146 -
 147
147 -
 148
148 -
 149
149 -
 150
150 -
 151
151 -
 152
152 -
 153
153 -
154
-
155
-
156
-
157
-
158
-
159
-
160
-
161
-
162
-
163
-
164
-
165
-
166
-
167
-
168
-
169
-
170
-
171
-
172
-
173
-
174
-
175
-
176
-
177
-
178
-
179
-
180
-
181
-
182
-
183
-
184
-
185
-
186
-
187
-
188
-
189
-
190
-
191
-
192
-
193
-
194
-
195
-
196
-
197
-
198
-
199
-
200
-
201
-
202
-
203
-
204
-
205
-
206
-
207
-
208
 |
 |

|141 >
NOTES TO THE
CONSOLIDATED
FINANCIAL
STATEMENTS
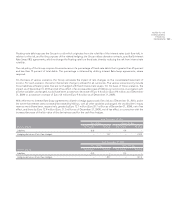
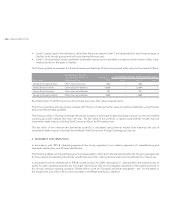
Floating–rate debt exposes the Group to a risk which originates from the volatility of the interest rates (cash flow risk). In
relation to this risk, and for the purposes of the related hedging, the Group utilizes derivate contracts, specifically Interest
Rate Swap (IRS) agreements, which exchange the floating rate for a fixed rate, thereby reducing the risk from interest rate
volatility.
The risk policy of the Group requires the maintenance of a percentage of fixed–rate debts that is greater than 25 percent
and less than 75 percent of total debts. This percentage is obtained by utilizing Interest Rate Swap agreements, where
required.
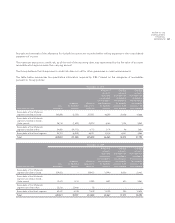
On the basis of various scenarios, the Group calculates the impact of rate changes on the consolidated statement of
income. For each scenario, the same interest rate change is utilized for all currencies. The various scenarios only include
those liabilities at floating rates that are not hedged with fixed interest rate swaps. On the basis of these scenarios, the
impact, as of December 31, 2010 and net of tax effect, of an increase/decrease of 100 bps on net income, in a situation with
all other variables unchanged, would have been a maximum decrease of Euro 4.4 million (Euro 9.4 million as of December
31, 2009) or a maximum increase of Euro 4.4 million (Euro 9.4 million as of December 31, 2009).
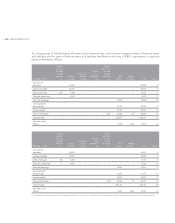
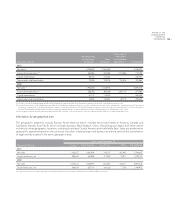
With reference to Interest Rate Swap agreements utilized to hedge against cash flow risk as of December 31, 2010, and in
the event that interest rates increased/decreased by 100 bps, with all other variables unchanged, the stockholders’ equity
reserves would have been, respectively, greater by Euro 12.7 million (Euro 20.7 million as of December 31, 2009), net of tax
effect, and lower by Euro 12.9 million (Euro 21.3 million as of December 31, 2009), net of tax effect, in connection with the
increase/decrease of the fair value of the derivatives used for the cash flow hedges.
(millions of Euro)
As of December 31, 2010
Plus 100 bps Minus 100 bps
Net income Reserve Net income Reserve
Liabilities (4.4) – 4.4 –
Hedging derivatives (Cash Flow Hedges) – 12.7 – (12.9)
(millions of Euro)
As of December 31, 2009
Plus 100 bps Minus 100 bps
Net income Reserve Net income Reserve
Liabilities (9.4) – 9.4 –
Hedging derivatives (Cash Flow Hedges) – 20.7 – (21.3)