LensCrafters 2010 Annual Report Download - page 153
Download and view the complete annual report
Please find page 153 of the 2010 LensCrafters annual report below. You can navigate through the pages in the report by either clicking on the pages listed below, or by using the keyword search tool below to find specific information within the annual report.-
 1
1 -
2
-
3
-
4
-
5
-
6
-
7
-
8
-
9
-
10
-
11
-
12
-
13
-
14
-
15
-
16
-
17
-
18
-
19
-
20
-
21
-
22
-
23
-
24
-
25
-
26
-
27
-
28
-
29
-
30
-
31
-
32
-
33
-
34
-
35
-
36
-
37
-
38
-
39
-
40
-
41
-
42
-
43
-
44
-
45
-
46
-
47
-
48
-
49
-
50
-
51
-
52
-
53
-
54
-
55
-
56
-
57
-
58
-
59
-
60
-
61
-
62
-
63
-
64
-
65
-
66
-
67
-
68
-
69
-
70
-
71
-
72
-
73
-
74
-
75
-
76
-
77
-
78
-
79
-
80
-
81
-
82
-
83
-
84
-
85
-
86
-
87
-
88
-
89
-
90
-
91
-
92
-
93
-
94
-
95
-
96
-
97
-
98
-
99
-
100
-
101
-
102
-
103
-
104
-
105
-
106
-
107
-
108
-
109
-
110
-
111
-
112
-
113
-
114
-
115
-
116
-
117
-
118
-
119
-
120
-
121
-
122
-
123
-
124
-
125
-
126
-
127
-
128
-
129
-
130
-
131
-
132
-
133
-
134
-
135
-
136
-
137
-
138
-
139
-
140
-
141
-
142
-
 143
143 -
 144
144 -
 145
145 -
 146
146 -
 147
147 -
 148
148 -
 149
149 -
 150
150 -
 151
151 -
 152
152 -
 153
153 -
 154
154 -
 155
155 -
 156
156 -
 157
157 -
 158
158 -
 159
159 -
 160
160 -
 161
161 -
 162
162 -
 163
163 -
164
-
165
-
166
-
167
-
168
-
169
-
170
-
171
-
172
-
173
-
174
-
175
-
176
-
177
-
178
-
179
-
180
-
181
-
182
-
183
-
184
-
185
-
186
-
187
-
188
-
189
-
190
-
191
-
192
-
193
-
194
-
195
-
196
-
197
-
198
-
199
-
200
-
201
-
202
-
203
-
204
-
205
-
206
-
207
-
208
 |
 |

|151 >
NOTES TO THE
CONSOLIDATED
FINANCIAL
STATEMENTS
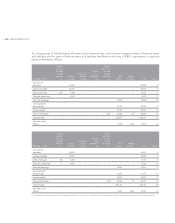
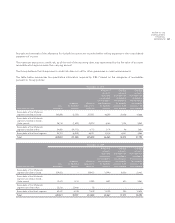
No intangibles associated to the business combinations were realized. The purchase price allocation has not been finalized
as of December 31, 2010 and will be reflected in 2011 financial statements.
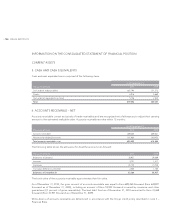
Amortization expense of Euro 107.2 million (Euro 83.1 million as of 31 December 2009) is included in general and
administrative expenses for Euro 106.2 million (Euro 83.1 million as of 31 December 2009) and in cost of sales for Euro 1.0
million (Euro 0 million as of December 31, 2009). Amortization expense for goodwill relates to impairment loss recorded
in the Retail distribution segment in 2010 for Euro 20.4 million
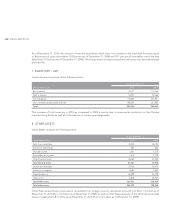
Impairment of goodwill
Pursuant to IAS 36 – Impairment of Assets – the Group has identified the following four cash–generating units: Wholesale,
Retail North America,Retail Asia–Pacific and Retail Other. The cash–generating units reflect the distribution model
adopted by the Group.
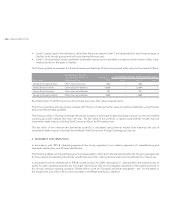
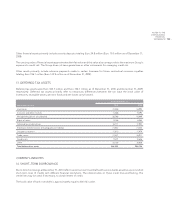
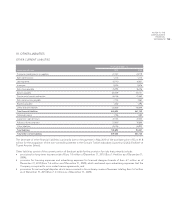
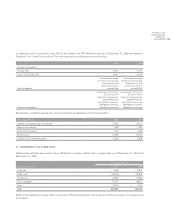
The value of goodwill allocated to each cash–generating unit is reported in the following table:
(thousands of Euro) 2010 2009
Wholesale 1,116,119 1,054,956
North America retail 1,372,638 1,292,685
Asia–Pacific retail 358,317 303,262
Retail – other 43,323 37,932
Total 2,890,397 2,688,835
The information required by paragraph 134 of IAS 36 is provided below only for the Wholesale and Retail North America
cash–generating units, since the value of goodwill allocated to these two units is a significant component of the total
Group goodwill.
The recoverable amount of each cash–generating unit has been verified by comparing its net assets carrying amounts to
its value in use.
The main assumptions for determining the value in use are reported below and refer to both cash generating units:
Growth rate: 2 percent•
Discount rate: 7.6 percent•
This growth rate is in line with the rate of the manufacturing sector of the countries in which the Group operates. The
discount rate has been determined on the basis of market information on the cost of money and the specific risk of
the industry (Weighed Average Cost of Capital, WACC). In particular, the Group used a methodology to determine
the discount rate which was in line with that utilized in the previous year, therefore, considering the rates of return on
long–term government bonds and the average capital structure of a group of comparable companies were taken into
account.
The recoverable amount of cash–generating units has been determined by utilizing post–tax cash flow forecasts based on
the three–year plan for the 2011–2013 period, prepared by management on the basis of the results attained in previous
years as well as management expectations – split by geographical area – on future trends in the eyewear market for
both the Wholesale and Retail distribution segments. The time period of cash flows was extended to the 2014–2015
period by creating forecasts on the basis of the growth rate reported above. At the end of the cash flow forecasting
period, a terminal value was estimated in order to reflect the value of the cash–generating unit after the period of the
plan. The terminal values were calculated as a perpetuity at the same growth rate as described above and represent
the present value, in the last year of the forecast, of all future perpetual cash flows. In particular, it should be noted that,