LensCrafters 2010 Annual Report Download - page 53
Download and view the complete annual report
Please find page 53 of the 2010 LensCrafters annual report below. You can navigate through the pages in the report by either clicking on the pages listed below, or by using the keyword search tool below to find specific information within the annual report.
|51 >
MANAGEMENT
REPORT
inventory increased by Euro 65.4 million, mainly due to currency fluctuation effects as well as increased production •
mainly in the Chinese manufacturing facility during 2010.
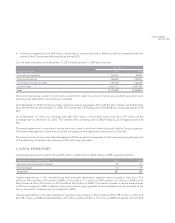
Our net financial position as of December 31, 2010 and December 31, 2009 was as follows:
December 31,
(thousands of Euro) 2010 2009
Cash and cash equivalents 679,852 380,081
Short–term borrowings (158,648) (148,951)
Current portion of long–term debt (197,566) (166,279)
Long–term debt (2,435,071) (2,401,796)
Total (2,111,433) (2,336,945)
Short–term borrowings consist of short–term uncommitted credit lines, most of which are overdrafts and short–term
revolving lines obtained by various Group companies.
As of December 31, 2010, the Group’s Italian companies had an aggregate of Euro 327.8 million in bank overdraft facilities
(Euro 391.8 million as of December 31, 2009). The interest rate is a floating rate of EURIBOR plus an average spread of 50
bps.
As of December 31, 2010, U.S. Holdings had US$ 130.2 million in short–term credit lines (Euro 97.4 million at the
exchange rate on December 31, 2010). The interest rate is a floating rate of LIBOR US$ plus an average spread of 40
bps.
The remaining amount is comprised of various short–term loans, in the form of revolving credit, held by Group companies.
The interest rate applied to these loans is usually a floating one that depends on the currency of the loan.
The current portion of long–term debt decreased in 2010 as a result of repayments of debt maturing during the year and
of the refinancing of certain loans maturing in 2010 with long–term debt.
4. CAPITAL EXPENDITURES
Capital expenditures amounted to Euro 230.5 million in 2010 and Euro 200.4 million in 2009, analyzed as follows:
Operating segment (millions of Euro) 2010 2009
Manufacturing and wholesale distribution 99 81
Retail distribution 132 119
Group total 231 200
Capital expenditures in the manufacturing and wholesale distribution segment were primarily in Italy (Euro 51.9
million in 2010 and Euro 35.0 million in 2009), in China (Euro 11.1 million in 2010 and Euro 6.1 million in 2009) and in
North America (Euro 30.0 million in 2010 and Euro 36.9 million in 2009). The overall increase in capital expenditures
in 2010 as compared to 2009 is related to the routine technology upgrades to the manufacturing structure and to the
set up of a new IT infrastructure, which started in 2009.
Capital expenditures in the retail distribution segment were primarily in North America (Euro 99.3 million in 2010 and
Euro 99.1 million in 2009) and Australia (Euro 24.9 million in 2010 and Euro 11.9 million in 2009) and related, for both 2010


