LensCrafters 2010 Annual Report Download - page 147
Download and view the complete annual report
Please find page 147 of the 2010 LensCrafters annual report below. You can navigate through the pages in the report by either clicking on the pages listed below, or by using the keyword search tool below to find specific information within the annual report.-
 1
1 -
2
-
3
-
4
-
5
-
6
-
7
-
8
-
9
-
10
-
11
-
12
-
13
-
14
-
15
-
16
-
17
-
18
-
19
-
20
-
21
-
22
-
23
-
24
-
25
-
26
-
27
-
28
-
29
-
30
-
31
-
32
-
33
-
34
-
35
-
36
-
37
-
38
-
39
-
40
-
41
-
42
-
43
-
44
-
45
-
46
-
47
-
48
-
49
-
50
-
51
-
52
-
53
-
54
-
55
-
56
-
57
-
58
-
59
-
60
-
61
-
62
-
63
-
64
-
65
-
66
-
67
-
68
-
69
-
70
-
71
-
72
-
73
-
74
-
75
-
76
-
77
-
78
-
79
-
80
-
81
-
82
-
83
-
84
-
85
-
86
-
87
-
88
-
89
-
90
-
91
-
92
-
93
-
94
-
95
-
96
-
97
-
98
-
99
-
100
-
101
-
102
-
103
-
104
-
105
-
106
-
107
-
108
-
109
-
110
-
111
-
112
-
113
-
114
-
115
-
116
-
117
-
118
-
119
-
120
-
121
-
122
-
123
-
124
-
125
-
126
-
127
-
128
-
129
-
130
-
131
-
132
-
133
-
134
-
135
-
136
-
 137
137 -
 138
138 -
 139
139 -
 140
140 -
 141
141 -
 142
142 -
 143
143 -
 144
144 -
 145
145 -
 146
146 -
 147
147 -
 148
148 -
 149
149 -
 150
150 -
 151
151 -
 152
152 -
 153
153 -
 154
154 -
 155
155 -
 156
156 -
 157
157 -
158
-
159
-
160
-
161
-
162
-
163
-
164
-
165
-
166
-
167
-
168
-
169
-
170
-
171
-
172
-
173
-
174
-
175
-
176
-
177
-
178
-
179
-
180
-
181
-
182
-
183
-
184
-
185
-
186
-
187
-
188
-
189
-
190
-
191
-
192
-
193
-
194
-
195
-
196
-
197
-
198
-
199
-
200
-
201
-
202
-
203
-
204
-
205
-
206
-
207
-
208
 |
 |

|145 >
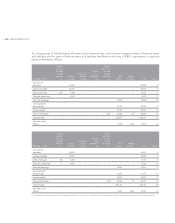
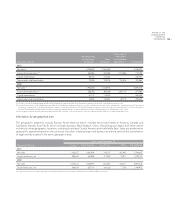
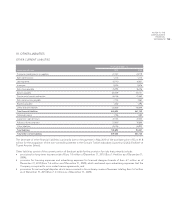
NOTES TO THE
CONSOLIDATED
FINANCIAL
STATEMENTS
(thousands of Euro)
Manufacturing
and wholesale
distribution
Retail
distribution
Inter–segment
transactions
and corporate
adjustments (3) Consolidated
2010
Net sales (1) 2,236,403 3,561,632 – 5,798,035
Income from operations (2) 461,854 424,384 (174,080) 712,158
Capital expenditures 98,724 131,633 230,357
Depreciation and amortization 79,028 139,216 103,818 322,062
2009
Net sales (1) 1,955,340 3,138,978 – 5,094,318
Income from operations (2) 356,032 360,769 (145,717) 571,085
Capital expenditures 81,175 119,234 – 200,409
Depreciation and amortization 76,005 129,261 80,179 285,445
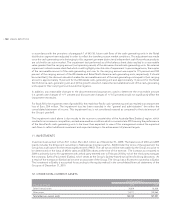
(1) Net sales of both the Manufacturing and Wholesale Distribution segment and the Retail Distribution segment include sales to third–party customers only.
(2) Income from operations of the Manufacturing and Wholesale Distribution segment is related to net sales to third–party customers only, excluding the “manufacturing profi t” generated
on the inter–company sales to the Retail Distribution segment. Income from operations of the Retail Distribution segment is related to retail sales, considering the cost of goods acquired
from the Manufacturing and Wholesale Distribution segment at manufacturing cost, thus including the relevant “manufacturing profi t” attributable to those sales.
(3) Inter–segment transactions and corporate adjustments include corporate costs not allocated to a specifi c segment and amortization of acquired intangible assets.
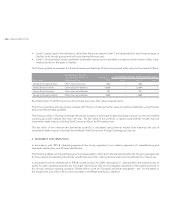
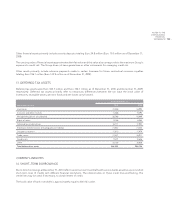
Information by geographical area
The geographic segments include Europe, North America (which includes the United States of America, Canada and
Caribbean islands), Asia–Pacific (which includes Australia, New Zealand, China, Hong Kong and Japan) and Other (which
includes all other geographic locations, including South and Central America and the Middle East). Sales are attributed to
geographic segments based on the customer’s location, whereas long–lived assets, net are the result of the combination
of legal entities located in the same geographic area.
(thousands of Euro)
Years ended December 31,
Europe (1) North America Asia–Pacific Other Consolidated
2010
Net sales 1,163,527 3,481,924 745,137 407,447 5,798,035
Long–lived assets, net 369,520 670,896 177,803 10,911 1,229,130
2009
Net sales 1,072,412 3,065,937 641,657 314,311 5,094,318
Long–lived assets, net 364,419 627,701 150,126 7,726 1,149,972
(1) Long–lived assets, net located in Italy represented 28 and 29 percent of the Group’s total fi xed assets in 2010 and 2009, respectively.