LensCrafters 2010 Annual Report Download - page 45
Download and view the complete annual report
Please find page 45 of the 2010 LensCrafters annual report below. You can navigate through the pages in the report by either clicking on the pages listed below, or by using the keyword search tool below to find specific information within the annual report.-
 1
1 -
2
-
3
-
4
-
5
-
6
-
7
-
8
-
9
-
10
-
11
-
12
-
13
-
14
-
15
-
16
-
17
-
18
-
19
-
20
-
21
-
22
-
23
-
24
-
25
-
26
-
27
-
28
-
29
-
30
-
31
-
32
-
33
-
34
-
 35
35 -
 36
36 -
 37
37 -
 38
38 -
 39
39 -
 40
40 -
 41
41 -
 42
42 -
 43
43 -
 44
44 -
 45
45 -
 46
46 -
 47
47 -
 48
48 -
 49
49 -
 50
50 -
 51
51 -
 52
52 -
 53
53 -
 54
54 -
 55
55 -
56
-
57
-
58
-
59
-
60
-
61
-
62
-
63
-
64
-
65
-
66
-
67
-
68
-
69
-
70
-
71
-
72
-
73
-
74
-
75
-
76
-
77
-
78
-
79
-
80
-
81
-
82
-
83
-
84
-
85
-
86
-
87
-
88
-
89
-
90
-
91
-
92
-
93
-
94
-
95
-
96
-
97
-
98
-
99
-
100
-
101
-
102
-
103
-
104
-
105
-
106
-
107
-
108
-
109
-
110
-
111
-
112
-
113
-
114
-
115
-
116
-
117
-
118
-
119
-
120
-
121
-
122
-
123
-
124
-
125
-
126
-
127
-
128
-
129
-
130
-
131
-
132
-
133
-
134
-
135
-
136
-
137
-
138
-
139
-
140
-
141
-
142
-
143
-
144
-
145
-
146
-
147
-
148
-
149
-
150
-
151
-
152
-
153
-
154
-
155
-
156
-
157
-
158
-
159
-
160
-
161
-
162
-
163
-
164
-
165
-
166
-
167
-
168
-
169
-
170
-
171
-
172
-
173
-
174
-
175
-
176
-
177
-
178
-
179
-
180
-
181
-
182
-
183
-
184
-
185
-
186
-
187
-
188
-
189
-
190
-
191
-
192
-
193
-
194
-
195
-
196
-
197
-
198
-
199
-
200
-
201
-
202
-
203
-
204
-
205
-
206
-
207
-
208
 |
 |
|43 >
MANAGEMENT
REPORT
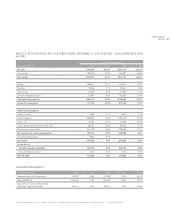
Gross profit. Our gross profit increased by Euro 476.1 million, or 14.3 percent, to Euro 3,807.8 million in 2010 from
Euro 3,331.7 million in 2009. As a percentage of net sales, gross profit was at 65.7 percent and 65.4 percent in 2010 and
2009, respectively, due to the factors noted above.
Operating expenses. Total operating expenses increased by Euro 335.0 million, or 12.1 percent, to Euro 3,095.7 million
in 2010 from Euro 2,760.6 million in 2009, in line with the increase of net sales in the period. As a percentage of net sales,
operating expenses decreased to 53.4 percent in 2010 from 54.2 percent in 2009.
Selling and advertising expenses (including royalty expenses) increased by Euro 263.6 million, or 12.5 percent, to
Euro 2,368.0 million in 2010 from Euro 2,104.4 million in 2009. Selling expenses increased by Euro 204.7 million, or 12.1
percent. Advertising expenses increased by Euro 59.9 million, or 19.2 percent. Royalties decreased by Euro 1.0 million, or
1.0 percent. As a percentage of net sales, selling and advertising expenses decreased to 40.8 percent in 2010, compared
to 41.3 percent in 2009, mainly due to the increase in net sales in relation to the fixed portion of selling expenses, such as
occupancy costs and fixed employee selling costs.
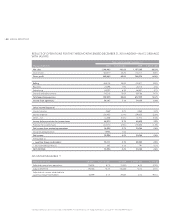
General and administrative expenses, including intangible asset amortization, increased by Euro 71.4 million, or 10.9 percent,
to Euro 727.7 million in 2010 as compared to Euro 656.3 million in 2009, mainly due to currency fluctuation effects and to the
impairment charge totaling approximately Euro 20 million on the goodwill allocated to the retail segment.
Income from operations. For the reasons described above, income from operations increased by Euro 141.1 million, or
24.7 percent, to Euro 712.2 million in 2010 from Euro 571.1 million in 2009. As a percentage of net sales, income from
operations increased to 12.3 percent in 2010 from 11.2 percent in 2009. Adjusted income from operations increased by
Euro 161.5 million, or 28.3 percent, to Euro 732.6 million in 2010 from Euro 571.1 million in 2009. As a percentage of net
sales, adjusted income from operations increased to 12.6 percent in 2010 from 11.2 percent in 2009.
Other income – Net. Other income (expense) – net was Euro (106.6) million in 2010 as compared to Euro (106.3) million in
2009. Net interest expense was Euro 98.5 million in 2010 as compared to Euro 102.2 million in 2009.
Net income. Income before taxes increased by Euro 140.8 million, or 30.3 percent, to Euro 605.5 million in 2010, from
Euro 464.8 million in 2009, for the reasons described above. As a percentage of net sales, income before taxes increased
to 10.4 percent in 2010, from 9.1 percent in the same period of 2009. Net income attributable to non–controlling interests
decreased to Euro 5.1 million in 2010 as compared to Euro 5.8 million in 2009. Discontinued operations were Euro 19.9
million and related to certain contingent liabilities originally recorded as part of the sale of our Things Remembered retail
business in 2006, which either settled or expired. Our effective tax rate was 36.0 percent and 34.4 percent in 2010 and
2009, respectively. Adjusted income before taxes (12) increased by Euro 161.2 million, or 34.7 percent, to Euro 626.0 million
in 2010, from Euro 464.8 million in 2009, for the reasons described above. As a percentage of net sales, adjusted income
before taxes increased to 10.8 percent in 2010, from 9.1 percent in the same period of 2009. Our adjusted effective tax rate
was 34.9 percent and 34.4 percent in 2010 and 2009, respectively.
Net income attributable to Luxottica Group stockholders increased by Euro 103.1 million, or 34.5 percent, to Euro 402.2
million in 2010, from Euro 299.1 million in 2009. Net income attributable to Luxottica Group stockholders as a percentage
of net sales increased to 6.9 percent in 2010, from 5.9 percent in 2009. Adjusted net income attributable to Luxottica
Group stockholders increased by Euro 103.6 million, or 34.6 percent, to Euro 402.7 million in 2010, from Euro 299.1 million
in 2009. Adjusted net income attributable to Luxottica Group stockholders as a percentage of net sales increased to 6.9
percent in 2010, from 5.9 percent in 2009.
Basic earnings per share from continuing operations were Euro 0.83 in 2010 as compared to Euro 0.65 in 2009. Basic
earnings per share were Euro 0.88 in 2010 as compared to Euro 0.65 in 2009. Diluted earnings per share from continuing
operations were Euro 0.83 in 2010 as compared to Euro 0.65 in 2009. Diluted earnings per share were Euro 0.87 in 2010 as
compared to Euro 0.65 in 2009. Adjusted basic earnings (13) per share were Euro 0.88 in 2010 as compared to Euro 0.65 in
2009. Adjusted diluted earnings (14) per share were Euro 0.87 in 2010 as compared to Euro 0.65 in 2009.
(12) For a further discussion on adjusted income before taxes, see page 64 and subs. – “Non–IAS/IFRS Measures”.
(13) For a further discussion of adjusted basic earnings per share, see page 64 and subs. – “Non–IAS/IFRS Measures”.
(14) For a further discussion of adjusted diluted earningsper share, see page 64 and subs. – “Non–IAS/IFRS Measures”.