LensCrafters 2010 Annual Report Download - page 167
Download and view the complete annual report
Please find page 167 of the 2010 LensCrafters annual report below. You can navigate through the pages in the report by either clicking on the pages listed below, or by using the keyword search tool below to find specific information within the annual report.-
 1
1 -
2
-
3
-
4
-
5
-
6
-
7
-
8
-
9
-
10
-
11
-
12
-
13
-
14
-
15
-
16
-
17
-
18
-
19
-
20
-
21
-
22
-
23
-
24
-
25
-
26
-
27
-
28
-
29
-
30
-
31
-
32
-
33
-
34
-
35
-
36
-
37
-
38
-
39
-
40
-
41
-
42
-
43
-
44
-
45
-
46
-
47
-
48
-
49
-
50
-
51
-
52
-
53
-
54
-
55
-
56
-
57
-
58
-
59
-
60
-
61
-
62
-
63
-
64
-
65
-
66
-
67
-
68
-
69
-
70
-
71
-
72
-
73
-
74
-
75
-
76
-
77
-
78
-
79
-
80
-
81
-
82
-
83
-
84
-
85
-
86
-
87
-
88
-
89
-
90
-
91
-
92
-
93
-
94
-
95
-
96
-
97
-
98
-
99
-
100
-
101
-
102
-
103
-
104
-
105
-
106
-
107
-
108
-
109
-
110
-
111
-
112
-
113
-
114
-
115
-
116
-
117
-
118
-
119
-
120
-
121
-
122
-
123
-
124
-
125
-
126
-
127
-
128
-
129
-
130
-
131
-
132
-
133
-
134
-
135
-
136
-
137
-
138
-
139
-
140
-
141
-
142
-
143
-
144
-
145
-
146
-
147
-
148
-
149
-
150
-
151
-
152
-
153
-
154
-
155
-
156
-
 157
157 -
 158
158 -
 159
159 -
 160
160 -
 161
161 -
 162
162 -
 163
163 -
 164
164 -
 165
165 -
 166
166 -
 167
167 -
 168
168 -
 169
169 -
 170
170 -
 171
171 -
 172
172 -
 173
173 -
 174
174 -
 175
175 -
 176
176 -
 177
177 -
178
-
179
-
180
-
181
-
182
-
183
-
184
-
185
-
186
-
187
-
188
-
189
-
190
-
191
-
192
-
193
-
194
-
195
-
196
-
197
-
198
-
199
-
200
-
201
-
202
-
203
-
204
-
205
-
206
-
207
-
208
 |
 |

|165 >
NOTES TO THE
CONSOLIDATED
FINANCIAL
STATEMENTS
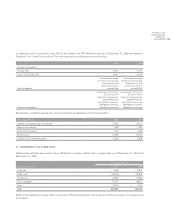
SERPs
2010 2009
Weighted–average assumptions used to determine net periodic benefit cost:
Discount rate:
For the year ended December 31 n.a. 6.15%
For the period prior to re–measurement 6.15% n.a.
For the period after re–measurement 5.50% n.a.
Expected long–term return on plan assets 8.00% 8.00%
Rate of compensation increase 5% / 3% / 2% 4% / 3% / 1%
Mortality table RP–2000 RP–2000
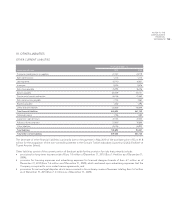
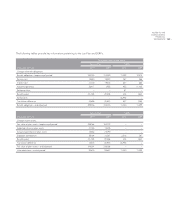
Defined benefit plan data for the current and previous four annual periods are as follows:
(thousands of Euro) 2010 2009 2008 2007 2006
Pension Plans:
Defined benefit obligation 409,316 334,015 313,520 272,611 277,468
Fair value of plan assets 314,501 238,168 184,379 224,533 224,262
Plan surplus/(deficit) 94,815 95,847 129,141 48,078 53,206
Plan liabilities experience gain/(loss) 1,744 (1,761) (4,379) (5,212) (6,414)
Plan assets experience gain/(loss) 14,462 23,790 (73,341) (2,619) 3,698
SERPs:
Defined benefit obligation 11,340 11,299 12,015 10,361 8,512
Fair value of plan assets – – – – –
Plan surplus/(deficit) (11,340) (11,299) (12,015) (10,361) (8,512)
Plan liabilities experience gain/(loss) 421 1,228 (927) 2,039 (1,799)
Plan assets experience gain/(loss) – – – – –
The Group’s discount rate is developed using a third party yield curve derived from non–callable bonds of at least an Aa
rating by Moody’s Investor Services or at least an AA rating by Standard & Poor’s. Each bond issue is required to have at
least $250 million par outstanding. The yield curve compares the future expected benefit payments of the Lux Pension
Plan to these bond yields to determine an equivalent discount rate.
The Group uses an assumption for salary increases based on a graduated approach of historical experience. The Group’s
experience shows salary increases that typically vary by age.
In developing the long–term rate of return assumption, the Group considers its asset allocation. The Group analyzed
historical rates of return being earned for each asset category over various periods of time. Additionally, the Group
considered input from its third–party pension asset managers, investment consultants and plan actuaries, including their
review of asset class return expectations and long–term inflation assumptions.
Plan Assets – The Lux Pension Plan’s investment policy is to invest plan assets in a manner to ensure over a long–term
investment horizon that the plan is adequately funded; maximize investment return within reasonable and prudent levels of
risk; and maintain sufficient liquidity to make timely benefit and administrative expense payments. This investment policy was
developed to provide the framework within which the fiduciary’s investment decisions are made, establish standards to measure