LensCrafters 2010 Annual Report Download - page 177
Download and view the complete annual report
Please find page 177 of the 2010 LensCrafters annual report below. You can navigate through the pages in the report by either clicking on the pages listed below, or by using the keyword search tool below to find specific information within the annual report.-
 1
1 -
2
-
3
-
4
-
5
-
6
-
7
-
8
-
9
-
10
-
11
-
12
-
13
-
14
-
15
-
16
-
17
-
18
-
19
-
20
-
21
-
22
-
23
-
24
-
25
-
26
-
27
-
28
-
29
-
30
-
31
-
32
-
33
-
34
-
35
-
36
-
37
-
38
-
39
-
40
-
41
-
42
-
43
-
44
-
45
-
46
-
47
-
48
-
49
-
50
-
51
-
52
-
53
-
54
-
55
-
56
-
57
-
58
-
59
-
60
-
61
-
62
-
63
-
64
-
65
-
66
-
67
-
68
-
69
-
70
-
71
-
72
-
73
-
74
-
75
-
76
-
77
-
78
-
79
-
80
-
81
-
82
-
83
-
84
-
85
-
86
-
87
-
88
-
89
-
90
-
91
-
92
-
93
-
94
-
95
-
96
-
97
-
98
-
99
-
100
-
101
-
102
-
103
-
104
-
105
-
106
-
107
-
108
-
109
-
110
-
111
-
112
-
113
-
114
-
115
-
116
-
117
-
118
-
119
-
120
-
121
-
122
-
123
-
124
-
125
-
126
-
127
-
128
-
129
-
130
-
131
-
132
-
133
-
134
-
135
-
136
-
137
-
138
-
139
-
140
-
141
-
142
-
143
-
144
-
145
-
146
-
147
-
148
-
149
-
150
-
151
-
152
-
153
-
154
-
155
-
156
-
157
-
158
-
159
-
160
-
161
-
162
-
163
-
164
-
165
-
166
-
 167
167 -
 168
168 -
 169
169 -
 170
170 -
 171
171 -
 172
172 -
 173
173 -
 174
174 -
 175
175 -
 176
176 -
 177
177 -
 178
178 -
 179
179 -
 180
180 -
 181
181 -
 182
182 -
 183
183 -
 184
184 -
 185
185 -
 186
186 -
 187
187 -
188
-
189
-
190
-
191
-
192
-
193
-
194
-
195
-
196
-
197
-
198
-
199
-
200
-
201
-
202
-
203
-
204
-
205
-
206
-
207
-
208
 |
 |

|175 >
NOTES TO THE
CONSOLIDATED
FINANCIAL
STATEMENTS
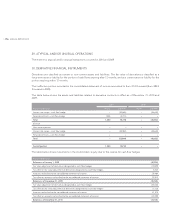
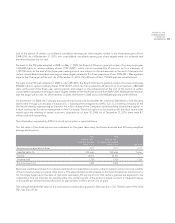
A summary of related party transactions as of December 31, 2010 and 2009 is provided below.
Related parties (thousands of Euro)
As of December 31, 2010
Income statement Balance sheet
Revenues Costs Assets Liabilities
Retail Brand Alliance, Inc. 112 731 – 59
Multiopticas Group 9,161 148 2,434 2,510
Eyebiz Laboratories Pty Limited – 33,941 616 14,054
Others 275 801 269 –
Total 9,548 35,621 3,319 16,623
Related parties (thousands of Euro)
As of December 31, 2009
Income statement Balance sheet
Revenues Costs Assets Liabilities
Retail Brand Alliance, Inc. 122 965 – 432
Multiopticas Group 5,358 – 2,469 –
Others 8 576 16 –
Total 5,488 1,541 2,485 432
Total remuneration due to key managers amounted to approximately Euro 29.0 million and Euro 27.6 million in 2010 and
2009, respectively.
These costs related to key managers who were already with the Group in 2008 and 2009 and remain in service, as well as
those who became key managers in 2010.
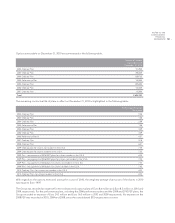
28. EARNINGS PER SHARE
Basic and diluted earnings per share were calculated as the ratio of net income attributable to the stockholders of the
Company for 2010 and 2009, respectively amounting to Euro 402,187 thousand and Euro 299,122 thousand, to the number
of outstanding shares – basic and dilutive of the Company.
Earnings per share in 2010 were equal to Euro 0.88 compared to Euro 0.65 in 2009. Diluted earnings in 2010 were equal to
Euro 0.87 compared to the Euro 0.65 in 2009, respectively.
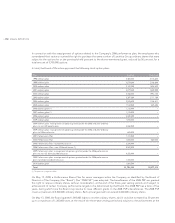
The table reported below provides the reconciliation between the average weighted number of shares utilized to calculate
basic and diluted earnings per share:
2010 2009
Weighted average shares outstanding – basic 458,711,441 457,270,491
Effect of dilutive stock options 1,823,956 667,311
Weighted average shares outstanding – dilutive 460,535,397 457,937,802
Options not included in calculation of dilutive shares as the exercise price was greater
than the average price during the respective period or performance measures related to
the awards have not yet been met 11,497,532 17,827,564