LensCrafters 2010 Annual Report Download - page 142
Download and view the complete annual report
Please find page 142 of the 2010 LensCrafters annual report below. You can navigate through the pages in the report by either clicking on the pages listed below, or by using the keyword search tool below to find specific information within the annual report.-
 1
1 -
2
-
3
-
4
-
5
-
6
-
7
-
8
-
9
-
10
-
11
-
12
-
13
-
14
-
15
-
16
-
17
-
18
-
19
-
20
-
21
-
22
-
23
-
24
-
25
-
26
-
27
-
28
-
29
-
30
-
31
-
32
-
33
-
34
-
35
-
36
-
37
-
38
-
39
-
40
-
41
-
42
-
43
-
44
-
45
-
46
-
47
-
48
-
49
-
50
-
51
-
52
-
53
-
54
-
55
-
56
-
57
-
58
-
59
-
60
-
61
-
62
-
63
-
64
-
65
-
66
-
67
-
68
-
69
-
70
-
71
-
72
-
73
-
74
-
75
-
76
-
77
-
78
-
79
-
80
-
81
-
82
-
83
-
84
-
85
-
86
-
87
-
88
-
89
-
90
-
91
-
92
-
93
-
94
-
95
-
96
-
97
-
98
-
99
-
100
-
101
-
102
-
103
-
104
-
105
-
106
-
107
-
108
-
109
-
110
-
111
-
112
-
113
-
114
-
115
-
116
-
117
-
118
-
119
-
120
-
121
-
122
-
123
-
124
-
125
-
126
-
127
-
128
-
129
-
130
-
131
-
 132
132 -
 133
133 -
 134
134 -
 135
135 -
 136
136 -
 137
137 -
 138
138 -
 139
139 -
 140
140 -
 141
141 -
 142
142 -
 143
143 -
 144
144 -
 145
145 -
 146
146 -
 147
147 -
 148
148 -
 149
149 -
 150
150 -
 151
151 -
 152
152 -
153
-
154
-
155
-
156
-
157
-
158
-
159
-
160
-
161
-
162
-
163
-
164
-
165
-
166
-
167
-
168
-
169
-
170
-
171
-
172
-
173
-
174
-
175
-
176
-
177
-
178
-
179
-
180
-
181
-
182
-
183
-
184
-
185
-
186
-
187
-
188
-
189
-
190
-
191
-
192
-
193
-
194
-
195
-
196
-
197
-
198
-
199
-
200
-
201
-
202
-
203
-
204
-
205
-
206
-
207
-
208
 |
 |

ANNUAL REPORT 2010> 140 |
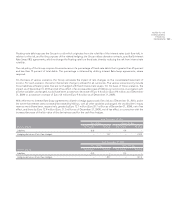
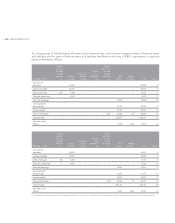
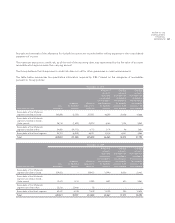
the tables relating to assets report the flows relative to only receivables. These amounts will be counterbalanced by the
payables, as reported in the tables relating to liabilities. With regards to interest rate swaps, the cash flows include the
settlement of the interest spread, both positive and negative, which expire during different periods. The various maturity
date categories represent the period of time between the date of the financial statements and the contractual maturity
date of the obligations, whether receivable or payable.
As of December 31, 2010 (thousands of Euro)
Less than
1 year
From
1 to 3 years
From
3 to 5 years
Beyond
5 years
Cash and cash equivalents 679,852 – – –
Derivatives receivable 2,183 – – –
Accounts receivable 655,892 – – –
Other current assets 63,327 – – –
As of December 31, 2009 (thousands of Euro)
Less than
1 year
From
1 to 3 years
From
3 to 5 years
Beyond
5 years
Cash and cash equivalents 380,081 – – –
Derivatives receivable 733 – 262 –
Accounts receivable 618,884 – – –
Other current assets 73,956 – – –
As of December 31, 2010 (thousands of Euro)
Less than
1 year
From
1 to 3 years
From
3 to 5 years
Beyond
5 years
Debt owed to banks and other financial institutions 428,385 1,321,627 959,664 374,975
Derivatives payable 44,951 20,505 – –
Accounts payable 537,742 – – –
Other current liabilities 440,590 – – –
As of December 31, 2009 (thousands of Euro)
Less than
1 year
From
1 to 3 years
From
3 to 5 years
Beyond
5 years
Debt owed to banks and other financial institutions 882,229 1,112,841 676,271 207,798
Derivatives payables 38,729 19,423 – –
Accounts payable 434,604 – – –
Other current liabilities 461,709 – – –
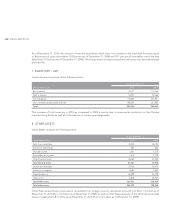
e) Interest rate risk
The interest rate risk to which the Group is exposed primarily originates from long–term debt. Such debt accrues interest
at both fixed and floating rates.
With regards to the risk arising from fixed–rate debt, the Group does not apply specific hedging policies since it does not
deem the risk to be material.