LensCrafters 2010 Annual Report Download - page 40
Download and view the complete annual report
Please find page 40 of the 2010 LensCrafters annual report below. You can navigate through the pages in the report by either clicking on the pages listed below, or by using the keyword search tool below to find specific information within the annual report.-
 1
1 -
2
-
3
-
4
-
5
-
6
-
7
-
8
-
9
-
10
-
11
-
12
-
13
-
14
-
15
-
16
-
17
-
18
-
19
-
20
-
21
-
22
-
23
-
24
-
25
-
26
-
27
-
28
-
29
-
 30
30 -
 31
31 -
 32
32 -
 33
33 -
 34
34 -
 35
35 -
 36
36 -
 37
37 -
 38
38 -
 39
39 -
 40
40 -
 41
41 -
 42
42 -
 43
43 -
 44
44 -
 45
45 -
 46
46 -
 47
47 -
 48
48 -
 49
49 -
 50
50 -
51
-
52
-
53
-
54
-
55
-
56
-
57
-
58
-
59
-
60
-
61
-
62
-
63
-
64
-
65
-
66
-
67
-
68
-
69
-
70
-
71
-
72
-
73
-
74
-
75
-
76
-
77
-
78
-
79
-
80
-
81
-
82
-
83
-
84
-
85
-
86
-
87
-
88
-
89
-
90
-
91
-
92
-
93
-
94
-
95
-
96
-
97
-
98
-
99
-
100
-
101
-
102
-
103
-
104
-
105
-
106
-
107
-
108
-
109
-
110
-
111
-
112
-
113
-
114
-
115
-
116
-
117
-
118
-
119
-
120
-
121
-
122
-
123
-
124
-
125
-
126
-
127
-
128
-
129
-
130
-
131
-
132
-
133
-
134
-
135
-
136
-
137
-
138
-
139
-
140
-
141
-
142
-
143
-
144
-
145
-
146
-
147
-
148
-
149
-
150
-
151
-
152
-
153
-
154
-
155
-
156
-
157
-
158
-
159
-
160
-
161
-
162
-
163
-
164
-
165
-
166
-
167
-
168
-
169
-
170
-
171
-
172
-
173
-
174
-
175
-
176
-
177
-
178
-
179
-
180
-
181
-
182
-
183
-
184
-
185
-
186
-
187
-
188
-
189
-
190
-
191
-
192
-
193
-
194
-
195
-
196
-
197
-
198
-
199
-
200
-
201
-
202
-
203
-
204
-
205
-
206
-
207
-
208
 |
 |

ANNUAL REPORT 2010> 38 |
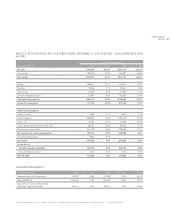
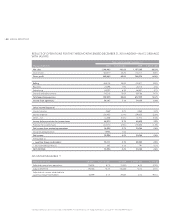
1. OPERATING PERFORMANCE FOR THREE MONTHS AND YEAR ENDED DECEMBER 31, 2010
Thanks to the strong growth enjoyed throughout all quarters of the year, total net sales for 2010 reached the unprecedented
figure of Euro 5.8 billion – never before seen in the history of Luxottica – as compared with Euro 5.1 billion for 2009 (+13.8
percent at current exchange rates and 7.1 percent at constant exchange rates (1)).
The year’s operating performance once again confirmed the success of Luxottica’s strategy to increase profitability. More
specifically, adjusted EBITDA (2) for 2010 recorded significant growth (+20.7 percent over 2009), reaching Euro 1,034.2
million. The adjusted EBITDA margin (3) increased from 16.8 percent in 2009 to 17.8 percent in 2010. In the fourth quarter
of 2010, adjusted EBITDA showed a 32.7 percent increase from the same period of the previous year, reaching Euro 192.8
million, with an adjusted EBITDA margin of 14.3 percent (12.6 percent in the fourth quarter of 2009).
Growth in adjusted income from operations (4) for 2010, amounting to Euro 732.6 million, was even more marked, with
+28.3 percent from the figure recorded at the end of 2009. The Group’s adjusted operating margin (5) increased from 11.2
percent for 2009 to 12.6 percent for 2010. In the fourth quarter of the year, adjusted income from operations (4) was Euro
116.6 million as compared with Euro 74.0 million recorded for the same period of the previous year (+57.5 percent), with
an adjusted operating margin (5) up from 6.4 percent for 2009 to 8.7 percent for 2010.
The income from operations of the Wholesale segment in 2010 amounted to Euro 461.9 million (+29.7 percent over 2009),
with an operating margin of 20.7 percent (+250 bps as compared with the previous year). In the fourth quarter of 2010, the
segment recorded operating income of Euro 89.6 million, +49.5 percent as compared with the same period of 2009, with
an operating margin of 17.5 percent (13.4 percent in the fourth quarter of 2009).
In 2010 the Retail segment recorded an income from operations of Euro 424.4 million, up by 17.6 percent over 2009, with
an operating margin of 11.9 percent (+40 bps). In the fourth quarter of 2010, operating income was Euro 70.5 million, +40.8
percent from the same period of the previous year, with an operating margin of 8.5 percent, +140 bps.
Adjusted net income attributable to Luxottica Group Stockholders (6) for 2010 amounted to Euro 402.7 million, up 34.6
percent from Euro 299.1 million for last year, corresponding to an adjusted Earnings per Share (EPS) (7) of Euro 0.88. In the
fourth quarter of 2010, adjusted net income attributable to Luxottica Group Stockholders (6) almost doubled, going from
Euro 29.3 million in 2009 to Euro 55.6 million (+90.1 percent) in 2010.
By carefully controlling working capital, the Group generated strong free cash flow (8), reaching Euro 616 million in 2010.
Free cash flow generated over the last two years therefore reached Euro 1.3 billion. As a result, net debt as of December
31, 2010 decreased further, falling to Euro 2,111 million (Euro 2,337 million at the end of 2009), and the ratio of net debt
to adjusted EBITDA (9) was 2.0x, as compared with 2.7x at end of 2009. For 2011, a further decrease in financial leverage
is expected.
(1) We calculate constant exchange rates by applying to the current period the average exchange rates between the Euro and the relevant currencies of the various markets in which we
operated during the year ended December 31, 2010. Please refer to the attachment to the notes to the consolidated fi nancial statements as of December 31, 2010, for further details on
exchange rates.
(2) For a further discussion of adjusted EBITDA, see page 64 and subs. – “Non–IAS/IFRS Measures”.
(3) For a further discussion of adjusted EBITDA margin, see page 64 and subs. – “Non–IAS/IFRS Measures”.
(4) For a further discussion of adjusted income from operations, see page 64 and subs. – “Non–IAS/IFRS Measures”.
(5) For a further discussion of adjusted operating margin, see page 64 and subs. – “Non–IAS/IFRS Measures”.
(6) For a further discussion of adjusted net income attributable to Luxottica Group Stockholders, see page 64 and subs. –“Non–IAS/IFRS Measures”.
(7) For a further discussion of adjusted EPS, see page 64 and subs. – “Non–IAS/IFRS Measures”.
(8) For a further discussion of free cash fl ow, see page 64 and subs. – “Non–IAS/IFRS Measures”.
(9) For a further discussion of net debt and the ratio of net debt to adjusted EBITDA, see page 64 and subs. – “Non–IAS/IFRS Measures”.
MANAGEMENT REPORT