LensCrafters 2010 Annual Report Download - page 48
Download and view the complete annual report
Please find page 48 of the 2010 LensCrafters annual report below. You can navigate through the pages in the report by either clicking on the pages listed below, or by using the keyword search tool below to find specific information within the annual report.-
 1
1 -
2
-
3
-
4
-
5
-
6
-
7
-
8
-
9
-
10
-
11
-
12
-
13
-
14
-
15
-
16
-
17
-
18
-
19
-
20
-
21
-
22
-
23
-
24
-
25
-
26
-
27
-
28
-
29
-
30
-
31
-
32
-
33
-
34
-
35
-
36
-
37
-
 38
38 -
 39
39 -
 40
40 -
 41
41 -
 42
42 -
 43
43 -
 44
44 -
 45
45 -
 46
46 -
 47
47 -
 48
48 -
 49
49 -
 50
50 -
 51
51 -
 52
52 -
 53
53 -
 54
54 -
 55
55 -
 56
56 -
 57
57 -
 58
58 -
59
-
60
-
61
-
62
-
63
-
64
-
65
-
66
-
67
-
68
-
69
-
70
-
71
-
72
-
73
-
74
-
75
-
76
-
77
-
78
-
79
-
80
-
81
-
82
-
83
-
84
-
85
-
86
-
87
-
88
-
89
-
90
-
91
-
92
-
93
-
94
-
95
-
96
-
97
-
98
-
99
-
100
-
101
-
102
-
103
-
104
-
105
-
106
-
107
-
108
-
109
-
110
-
111
-
112
-
113
-
114
-
115
-
116
-
117
-
118
-
119
-
120
-
121
-
122
-
123
-
124
-
125
-
126
-
127
-
128
-
129
-
130
-
131
-
132
-
133
-
134
-
135
-
136
-
137
-
138
-
139
-
140
-
141
-
142
-
143
-
144
-
145
-
146
-
147
-
148
-
149
-
150
-
151
-
152
-
153
-
154
-
155
-
156
-
157
-
158
-
159
-
160
-
161
-
162
-
163
-
164
-
165
-
166
-
167
-
168
-
169
-
170
-
171
-
172
-
173
-
174
-
175
-
176
-
177
-
178
-
179
-
180
-
181
-
182
-
183
-
184
-
185
-
186
-
187
-
188
-
189
-
190
-
191
-
192
-
193
-
194
-
195
-
196
-
197
-
198
-
199
-
200
-
201
-
202
-
203
-
204
-
205
-
206
-
207
-
208
 |
 |
ANNUAL REPORT 2010> 46 |
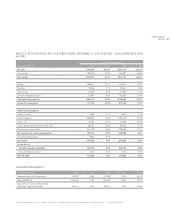
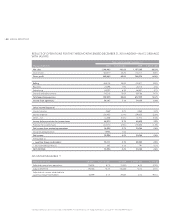
increase in net sales in the United States and Canada of US$ 12.3 million, or 8.5 percent, during the three–month period
ended December 31, 2010, compared to the same period of 2009, was primarily due to a general increase in consumer
demand. During the three–month period ended December 31, 2010, net sales to third parties in our manufacturing and
wholesale distribution segment in the rest of the world were Euro 176.8 million, comprising 34.4 percent of our total
net sales in this segment, compared to Euro 141.3 million in the same period of 2009, or 31.5 percent of our net sales in
this segment, which increase was primarily due to a general increase in consumer demand as well as positive currency
fluctuation effects.
Cost of sales. Cost of sales increased by Euro 50.7 million, or 12.4 percent, to Euro 460.8 million during the three–month
period ended December 31, 2010, from Euro 410.1 million in the same period of 2009. As a percentage of net sales, cost
of sales decreased to 34.2 percent during the three–month period ended December 31, 2010 as compared to 35.4 percent
in the same period of 2009, primarily due to the positive effect of the selling price mix, that resulted from increased
sales of higher margin products. During the three–month period ended December 31, 2010, the average number of
frames produced daily in our facilities increased to approximately 228,200 as compared to 218,300 in the same period of
2009, which was attributable to increased production in all manufacturing facilities except for the manufacturing facility in
California, in response to an overall increase in demand.
Gross profit. Our gross profit increased by Euro 138.7 million, or 18.6 percent, to Euro 885.7 million during the three–
month period ended December 31, 2010, from Euro 747.0 million in the same period of 2009. As a percentage of net sales,
gross profit increased to 65.8 percent during the three–month period ended December 31, 2010, from 64.6 percent in the
same period of 2009, due to the factors noted above.
Operating expenses. Total operating expenses increased by Euro 116.6 million, or 17.3 percent, to Euro 789.5 million
during the three–month period ended December 31, 2010, from Euro 672.9 million in the same period of 2009, in
line with the increase in net sales occurred in the period. As a percentage of net sales, operating expenses increased
to 58.6 percent during the three–month period ended December 31, 2010, from 58.2 percent in the same period of
2009, primarily due to an increase in sales while maintaining strong cost controls over general and administrative
expenses.
Selling and advertising expenses (including royalty expenses) increased by Euro 76.1 million, or 15.1 percent, to Euro 579.2
million during the three–month period ended December 31, 2010, from Euro 503.2 million in the same period of 2009.
Selling expenses increased by Euro 58.2 million, or 14.2 percent. Advertising expenses increased by Euro 18.9 million, or
28.4 percent. Royalties decreased by Euro 1.0 million, or 3.9 percent. As a percentage of net sales, selling and advertising
expenses were at 43.0 percent during the three–month period ended December 31, 2010, compared to 43.5 percent for
the same period of 2009.
General and administrative expenses, including intangible asset amortization, increased to Euro 210.3 million during the
three–month period ended December 31, 2010, compared to Euro 169.8 million in the same period of 2009. The increase
is mainly due to the an impairment charge totaling approximately Euro 20 million on the goodwill allocated to the retail
segment. As a percentage of net sales, general and administrative expenses decreased from 14.7 percent in 2009 to 15.6
percent in 2010.
Income from operations. For the reasons described above, income from operations increased by Euro 22.1 million, or
29.9 percent, to Euro 96.1 million during the three–month period ended December 31, 2010, from Euro 74.0 million
in the same period of 2009. As a percentage of net sales, income from operations increased to 7.1 percent during the
three–month period ended December 31, 2010, from 6.4 percent in the same period of 2009. Adjusted income from
operations increased by Euro 42.6 million, or 57.5 percent, to Euro 116.6 million during the three–month period ended
December 31, 2010, from Euro 74.0 million in the same period of 2009. As a percentage of net sales, income from
operations increased to 8.7 percent during the three–month period ended December 31, 2010, from 6.4 percent in the
same period of 2009.