LensCrafters 2010 Annual Report Download - page 49
Download and view the complete annual report
Please find page 49 of the 2010 LensCrafters annual report below. You can navigate through the pages in the report by either clicking on the pages listed below, or by using the keyword search tool below to find specific information within the annual report.-
 1
1 -
2
-
3
-
4
-
5
-
6
-
7
-
8
-
9
-
10
-
11
-
12
-
13
-
14
-
15
-
16
-
17
-
18
-
19
-
20
-
21
-
22
-
23
-
24
-
25
-
26
-
27
-
28
-
29
-
30
-
31
-
32
-
33
-
34
-
35
-
36
-
37
-
38
-
 39
39 -
 40
40 -
 41
41 -
 42
42 -
 43
43 -
 44
44 -
 45
45 -
 46
46 -
 47
47 -
 48
48 -
 49
49 -
 50
50 -
 51
51 -
 52
52 -
 53
53 -
 54
54 -
 55
55 -
 56
56 -
 57
57 -
 58
58 -
 59
59 -
60
-
61
-
62
-
63
-
64
-
65
-
66
-
67
-
68
-
69
-
70
-
71
-
72
-
73
-
74
-
75
-
76
-
77
-
78
-
79
-
80
-
81
-
82
-
83
-
84
-
85
-
86
-
87
-
88
-
89
-
90
-
91
-
92
-
93
-
94
-
95
-
96
-
97
-
98
-
99
-
100
-
101
-
102
-
103
-
104
-
105
-
106
-
107
-
108
-
109
-
110
-
111
-
112
-
113
-
114
-
115
-
116
-
117
-
118
-
119
-
120
-
121
-
122
-
123
-
124
-
125
-
126
-
127
-
128
-
129
-
130
-
131
-
132
-
133
-
134
-
135
-
136
-
137
-
138
-
139
-
140
-
141
-
142
-
143
-
144
-
145
-
146
-
147
-
148
-
149
-
150
-
151
-
152
-
153
-
154
-
155
-
156
-
157
-
158
-
159
-
160
-
161
-
162
-
163
-
164
-
165
-
166
-
167
-
168
-
169
-
170
-
171
-
172
-
173
-
174
-
175
-
176
-
177
-
178
-
179
-
180
-
181
-
182
-
183
-
184
-
185
-
186
-
187
-
188
-
189
-
190
-
191
-
192
-
193
-
194
-
195
-
196
-
197
-
198
-
199
-
200
-
201
-
202
-
203
-
204
-
205
-
206
-
207
-
208
 |
 |

|47 >
MANAGEMENT
REPORT
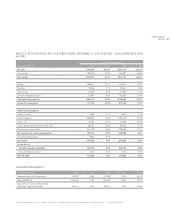
Other income (expense) – Net. Other income (expense) – net was Euro (28.1) million during the three–month period
ended December 31, 2010, compared to Euro (29.4) million in the same period of 2009. Net interest expense decreased
to Euro 25.8 million during the three–month period ended December 31, 2010, compared to Euro 27.3 million in the same
period of 2009.
Net income. Income before taxes increased by Euro 23.4 million, or 52.5 percent, to Euro 68.1 million during the three–month
period ended December 31, 2010, from Euro 44.6 million in the same period of 2009, for the reasons described above. As a
percentage of net sales, income before taxes increased to 5.1 percent during the three–month period ended December 31,
2010, from 3.9 percent in the same period of 2009. Net income attributable to non–controlling interests increased to Euro
0.9 million during the three–month period ended December 31, 2010, compared to Euro 0.8 million in the same period of
2009. Our effective tax rate was 47.0 percent during the three–month period ended December 31, 2010, compared to 32.7
percent in the same period of 2009. Adjusted income before taxes increased by Euro 43.9 million, or 98.3 percent, to Euro
88.5 million during the three–month period ended December 31, 2010, from Euro 44.6 million in the same period of 2009. As
a percentage of net sales, income before taxes increased to 6.6 percent during the three–month period ended December 31,
2010, from 3.9 percent in the same period of 2009. Our adjusted effective tax rate was 36.2 percent during the three–month
period ended December 31, 2010, compared to 32.7 percent in the same period of 2009.
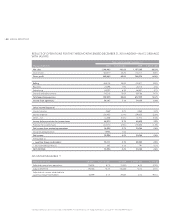
Net income attributable to Luxottica Group stockholders increased by Euro 25.9 million, or 88.4 percent, to Euro 55.1
million during the three–month period ended December 31, 2010, from Euro 29.3 million in the same period of 2009.
Net income attributable to Luxottica Group stockholders as a percentage of net sales increased to 4.1 percent during
the three–month period ended December 31, 2010, from 2.5 percent in the same period of 2009. Adjusted net income
attributable to Luxottica Group stockholders increased by Euro 26.3 million, or 90.1 percent, to Euro 55.6 million during
the three–month period ended December 31, 2010, from Euro 29.3 million in the same period of 2009. Net income
attributable to Luxottica Group stockholders as a percentage of net sales increased to 4.1 percent during the three–month
period ended December 31, 2010, from 2.5 percent in the same period of 2009.
Basic and diluted earnings per share from continuing operations were Euro 0.08 during the three–month period ended
December 31, 2010 as compared to Euro 0.06 in the same period of 2009. Basic and diluted earnings per share were
Euro 0.12 during the three–month period ended December 31, 2010, compared to Euro 0.06 in the same period of 2009.
Adjusted basic earnings per share were Euro 0.12 during the three–month period ended December 31, 2010, compared to
Euro 0.06 in the same period of 2009. Adjusted diluted earnings per share were Euro 0.12 during the three–month period
ended December 31, 2010, compared to Euro 0.06 in the same period of 2009.
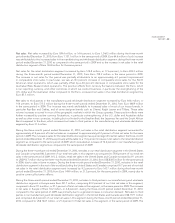
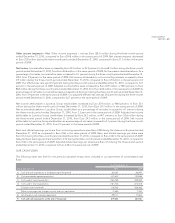
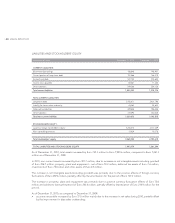
OUR CASH FLOWS
The following table sets forth for the periods indicated certain items included in our statements of consolidated cash
flows:
As of December 31,
(thousands of Euro) 2010 2009
A) Cash and cash equivalents at the beginning of the period 380,081 288,450
B) Cash provided by operating activities 831,633 903,488
C) Cash used in investing activities (367,283) (229,269)
D) Cash used in financing activities (167,700) (373,473)
Change in bank overdrafts (18,563) (226,566)
Effect of exchange rate changes on cash and cash equivalents 21,684 17,452
E) Net change in cash and cash equivalents 299,771 91,632
F) Cash and cash equivalents at the end of the period 679,852 380,081