LensCrafters 2010 Annual Report Download - page 50
Download and view the complete annual report
Please find page 50 of the 2010 LensCrafters annual report below. You can navigate through the pages in the report by either clicking on the pages listed below, or by using the keyword search tool below to find specific information within the annual report.-
 1
1 -
2
-
3
-
4
-
5
-
6
-
7
-
8
-
9
-
10
-
11
-
12
-
13
-
14
-
15
-
16
-
17
-
18
-
19
-
20
-
21
-
22
-
23
-
24
-
25
-
26
-
27
-
28
-
29
-
30
-
31
-
32
-
33
-
34
-
35
-
36
-
37
-
38
-
39
-
 40
40 -
 41
41 -
 42
42 -
 43
43 -
 44
44 -
 45
45 -
 46
46 -
 47
47 -
 48
48 -
 49
49 -
 50
50 -
 51
51 -
 52
52 -
 53
53 -
 54
54 -
 55
55 -
 56
56 -
 57
57 -
 58
58 -
 59
59 -
 60
60 -
61
-
62
-
63
-
64
-
65
-
66
-
67
-
68
-
69
-
70
-
71
-
72
-
73
-
74
-
75
-
76
-
77
-
78
-
79
-
80
-
81
-
82
-
83
-
84
-
85
-
86
-
87
-
88
-
89
-
90
-
91
-
92
-
93
-
94
-
95
-
96
-
97
-
98
-
99
-
100
-
101
-
102
-
103
-
104
-
105
-
106
-
107
-
108
-
109
-
110
-
111
-
112
-
113
-
114
-
115
-
116
-
117
-
118
-
119
-
120
-
121
-
122
-
123
-
124
-
125
-
126
-
127
-
128
-
129
-
130
-
131
-
132
-
133
-
134
-
135
-
136
-
137
-
138
-
139
-
140
-
141
-
142
-
143
-
144
-
145
-
146
-
147
-
148
-
149
-
150
-
151
-
152
-
153
-
154
-
155
-
156
-
157
-
158
-
159
-
160
-
161
-
162
-
163
-
164
-
165
-
166
-
167
-
168
-
169
-
170
-
171
-
172
-
173
-
174
-
175
-
176
-
177
-
178
-
179
-
180
-
181
-
182
-
183
-
184
-
185
-
186
-
187
-
188
-
189
-
190
-
191
-
192
-
193
-
194
-
195
-
196
-
197
-
198
-
199
-
200
-
201
-
202
-
203
-
204
-
205
-
206
-
207
-
208
 |
 |
ANNUAL REPORT 2010> 48 |
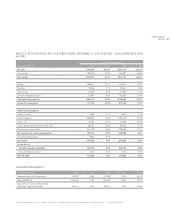
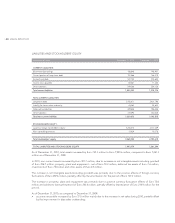
Operating activities. The Company’s net cash provided by operating activities was Euro 831.6 million, and Euro 903.5
million for 2010 and 2009.
Depreciation and amortization were Euro 322.1 million in 2010 as compared to Euro 285.4 million in 2009. The increase in
depreciation and amortization in 2010 as compared to 2009 is primarily attributable to a non–recurring impairment charge
totaling approximately Euro 20 million.
Non–cash stock–based compensation expense was Euro 32.9 million in 2010 as compared to Euro 24.9 million in 2009.
The increase in 2010 as compared to 2009 is mainly due to expense related to the new stock option plan granted in 2010
for approximately Euro 5.1 million.
The change in accounts receivable was Euro (1.6) million in 2010 as compared to Euro 25.7 million in 2009. This change in
2010 as compared to 2009 was primarily due to an increase in sales volume in 2010 as compared to 2009. The inventory
change was Euro (36.5) million in 2010 as compared to Euro 46.7 million in 2009. The change in 2010 as compared to 2009
was mainly due to increased production in our Chinese manufacturing facilities. The change in accounts payable was
Euro 86.7 million in 2010 as compared to Euro 27.5 million in 2009. The change in 2010 as compared to 2009 was mainly
due to better payment terms with the vendors in 2009, which continued to show their positive effects in 2010 as well.
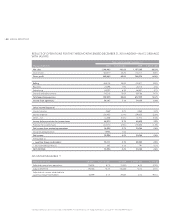
The change in prepaid/accrued expenses and other was Euro (21.1) million in 2010 as compared to Euro 180.0 million in
2009. The change in 2010 as compared to 2009 was mainly due to the timing of payments to tax authorities by certain
U.S. subsidiaries of the Company which are expected to be utilized during the first half of 2011. The change in 2009 is
mainly due to the collection of certain U.S. tax receivables for approximately Euro 44.5 million and the utilization of tax
prepayments of Euro 57.8 million to offset the tax payments which came due during 2009. The change in income taxes
payable was Euro 32.5 million in 2010 as compared to Euro (16.7) million in 2009. The change in 2010 as compared to 2009
was primarily attributable to higher taxable income in 2010 which resulted in an increase in the income tax payable as
compared to the same period of 2009.
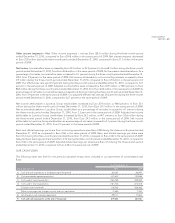
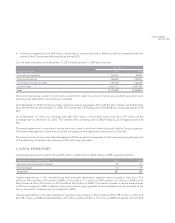
Investing activities. The Company’s net cash used in investing activities was Euro (367.3) million and Euro (229.3) million
in 2010 and 2009, respectively. The cash used in investing activities primarily consisted of (i) Euro (230.4) million in capital
expenditures in 2010 as compared to Euro (200.4) million in the same period of 2009, (ii) Euro (20.7) million for the payment
of the second installment of the purchase price for the acquisition of a 40 percent investment in Multiopticas Internacional
S.L., which occurred in 2010, (iii) Euro (61.8) million for the purchase of the remaining non–controlling interests in Luxottica
Turkey, which occurred in 2010, and (iv) Euro (32.4) million for the purchase of the remaining non–controlling interests of
Sunglass Hut (UK), which occurred in 2010.
Financing activities. The Company’s net cash provided by/(used in) financing activities was Euro (167.6) million and
Euro (373.5) million in 2010 and 2009 respectively. Cash used in financing activities in 2010 mainly related to proceeds
of Euro 881.7 million from long–term debt borrowings, the repayment of maturing outstanding debt for Euro (930.4)
million and aggregate dividend payments to stockholders of Euro (169.8) million. In 2009, cash used in financing activities
mainly related to proceeds of Euro 987.7 million from long–term debt borrowings, the repayment of bank borrowings for
Euro (57.4) million and the maturing of outstanding debt of Euro (1,215.0) million and aggregate dividend payments to
stockholders of Euro (103.5) million.