LensCrafters 2010 Annual Report Download - page 144
Download and view the complete annual report
Please find page 144 of the 2010 LensCrafters annual report below. You can navigate through the pages in the report by either clicking on the pages listed below, or by using the keyword search tool below to find specific information within the annual report.-
 1
1 -
2
-
3
-
4
-
5
-
6
-
7
-
8
-
9
-
10
-
11
-
12
-
13
-
14
-
15
-
16
-
17
-
18
-
19
-
20
-
21
-
22
-
23
-
24
-
25
-
26
-
27
-
28
-
29
-
30
-
31
-
32
-
33
-
34
-
35
-
36
-
37
-
38
-
39
-
40
-
41
-
42
-
43
-
44
-
45
-
46
-
47
-
48
-
49
-
50
-
51
-
52
-
53
-
54
-
55
-
56
-
57
-
58
-
59
-
60
-
61
-
62
-
63
-
64
-
65
-
66
-
67
-
68
-
69
-
70
-
71
-
72
-
73
-
74
-
75
-
76
-
77
-
78
-
79
-
80
-
81
-
82
-
83
-
84
-
85
-
86
-
87
-
88
-
89
-
90
-
91
-
92
-
93
-
94
-
95
-
96
-
97
-
98
-
99
-
100
-
101
-
102
-
103
-
104
-
105
-
106
-
107
-
108
-
109
-
110
-
111
-
112
-
113
-
114
-
115
-
116
-
117
-
118
-
119
-
120
-
121
-
122
-
123
-
124
-
125
-
126
-
127
-
128
-
129
-
130
-
131
-
132
-
133
-
 134
134 -
 135
135 -
 136
136 -
 137
137 -
 138
138 -
 139
139 -
 140
140 -
 141
141 -
 142
142 -
 143
143 -
 144
144 -
 145
145 -
 146
146 -
 147
147 -
 148
148 -
 149
149 -
 150
150 -
 151
151 -
 152
152 -
 153
153 -
 154
154 -
155
-
156
-
157
-
158
-
159
-
160
-
161
-
162
-
163
-
164
-
165
-
166
-
167
-
168
-
169
-
170
-
171
-
172
-
173
-
174
-
175
-
176
-
177
-
178
-
179
-
180
-
181
-
182
-
183
-
184
-
185
-
186
-
187
-
188
-
189
-
190
-
191
-
192
-
193
-
194
-
195
-
196
-
197
-
198
-
199
-
200
-
201
-
202
-
203
-
204
-
205
-
206
-
207
-
208
 |
 |

ANNUAL REPORT 2010> 142 |
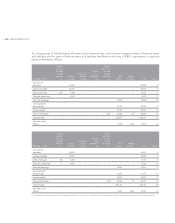
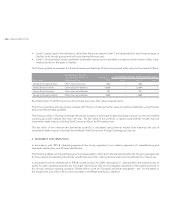
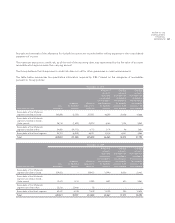
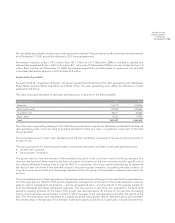
For the purposes of fully disclosing information about financial risks, a reconciliation between classes of financial assets
and liabilities and the types of financial assets and liabilities identified on the basis of IFRS 7 requirements is reported
below (in thousands of Euro):
December 31, 2010
Financial
assets at
fair value
through
profit and
loss
Accounts
receivable
Investments
held until
maturity
Financial
assets
available for
sale
Financial
liabilities at
fair value
through
profit and
loss
Other
liabilities
Hedging
derivatives Total Note (*)
Cash and cash
equivalents – 679,852 – – – – – 679,852 5
Accounts receivable – 655,892 – – – – – 655,892 6
Other current assets 1,484 61,843 – – – – – 63,327 8
Other non–current assets – 34,240 – – – – – 34,240 12
Short–term borrowings – – – – – 158,648 – 158,648 14
Current portion of
long–term debt – – – – – 197,566 – 197,566 15
Accounts payable – – – – – 537,742 – 537,742 16
Other current liabilities – – – – 4,689 435,000 901 440,590 18
Long–term debt – – – – – 2,435,071 – 2,435,071 19
Other non–current
liabilities – – – – – 61,694 52,964 114,658 22
December 31, 2009
Financial
assets at
fair value
through
profit and
loss
Accounts
receivabls
Investments
held until
maturity
Financial
assets
available for
sale
Financial
liabilities at
fair value
through
profit and
loss
Other
liabilities
Hedging
derivatives Total Note (*)
Cash and cash
equivalents – 380,081 – – – – – 380,081 5
Accounts receivable – 618,884 – – – – – 618,884 6
Other current assets 1,028 72,928 – – – – – 73,956 8
Other non–current assets – 18,026 – – – – – 18,026 12
Short–term borrowings – – – – – 148,951 – 148,951 14
Current portion of
long–term debt – – – – – 166,279 – 166,279 15
Accounts payable – – – – – 434,604 – 434,604 16
Other current liabilities – – – – 3,629 458,004 76 461,709 18
Long–term debt – – – – – 2,401,796 – 2,401,796 19
Other non–current
liabilities – – – – – 88,819 48,642 137,461 22
(*) The numbers reported above refer to the paragraphs within these notes to the consolidated fi nancial statements in which the fi nancial assets and liabilities are further explained.