LensCrafters 2010 Annual Report Download - page 150
Download and view the complete annual report
Please find page 150 of the 2010 LensCrafters annual report below. You can navigate through the pages in the report by either clicking on the pages listed below, or by using the keyword search tool below to find specific information within the annual report.-
 1
1 -
2
-
3
-
4
-
5
-
6
-
7
-
8
-
9
-
10
-
11
-
12
-
13
-
14
-
15
-
16
-
17
-
18
-
19
-
20
-
21
-
22
-
23
-
24
-
25
-
26
-
27
-
28
-
29
-
30
-
31
-
32
-
33
-
34
-
35
-
36
-
37
-
38
-
39
-
40
-
41
-
42
-
43
-
44
-
45
-
46
-
47
-
48
-
49
-
50
-
51
-
52
-
53
-
54
-
55
-
56
-
57
-
58
-
59
-
60
-
61
-
62
-
63
-
64
-
65
-
66
-
67
-
68
-
69
-
70
-
71
-
72
-
73
-
74
-
75
-
76
-
77
-
78
-
79
-
80
-
81
-
82
-
83
-
84
-
85
-
86
-
87
-
88
-
89
-
90
-
91
-
92
-
93
-
94
-
95
-
96
-
97
-
98
-
99
-
100
-
101
-
102
-
103
-
104
-
105
-
106
-
107
-
108
-
109
-
110
-
111
-
112
-
113
-
114
-
115
-
116
-
117
-
118
-
119
-
120
-
121
-
122
-
123
-
124
-
125
-
126
-
127
-
128
-
129
-
130
-
131
-
132
-
133
-
134
-
135
-
136
-
137
-
138
-
139
-
 140
140 -
 141
141 -
 142
142 -
 143
143 -
 144
144 -
 145
145 -
 146
146 -
 147
147 -
 148
148 -
 149
149 -
 150
150 -
 151
151 -
 152
152 -
 153
153 -
 154
154 -
 155
155 -
 156
156 -
 157
157 -
 158
158 -
 159
159 -
 160
160 -
161
-
162
-
163
-
164
-
165
-
166
-
167
-
168
-
169
-
170
-
171
-
172
-
173
-
174
-
175
-
176
-
177
-
178
-
179
-
180
-
181
-
182
-
183
-
184
-
185
-
186
-
187
-
188
-
189
-
190
-
191
-
192
-
193
-
194
-
195
-
196
-
197
-
198
-
199
-
200
-
201
-
202
-
203
-
204
-
205
-
206
-
207
-
208
 |
 |
ANNUAL REPORT 2010> 148 |
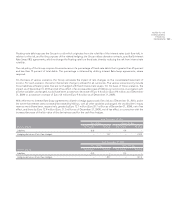
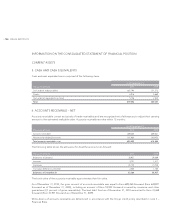
As of December 31, 2010, the amount of overdue receivables which were not included in the bad debt fund was equal
to 9,6 percent of gross receivables (10,8 percent as of December 31, 2009) and 10,1 percent of receivables net of the bad
debt fund (11,3 percent as of December 31, 2009). The Group does not expect any additional losses over amounts already
provided for.
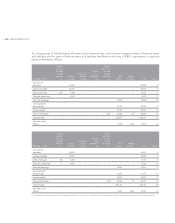
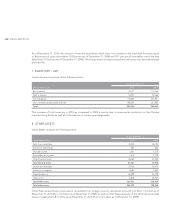
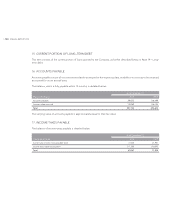
7. INVENTORY – NET
Inventories are comprised of the following items:
(thousands of Euro)
As of December 31,
2010 2009
Raw materials 115,277 112,760
Work in process 52,507 52,368
Finished goods 518,804 440,927
Less: inventory obsolescence reserves (96,552) (81,392)
Total 590,036 524,663
The increase of total inventory in 2010 as compared to 2009 is mainly due to incremental production in the Chinese
manufacturing facility as well as to fluctuations in currency exchange rates.
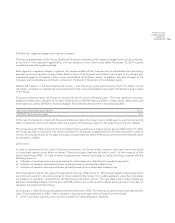
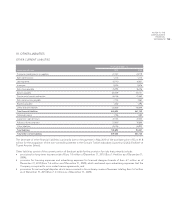
8. OTHER ASSETS
Other assets comprise the following items:
(thousands of Euro)
As of December 31,
2010 2009
Sales taxes receivable 32,524 26,104
Short–term borrowings 860 806
Accrued income 1,501 1,272
Receivables for royalties 2,078 2,229
Other financial assets 26,364 43,545
Total financial assets 63,327 73,956
Income tax receivable 70,720 33,413
Advances to suppliers 9,487 1,545
Prepaid expenses 66,399 61,424
Other assets 16,825 28,027
Total other assets 163,431 124,409
Total other assets 226,759 198,365
Other financial assets are composed of receivables from foreign currency derivatives amounting to Euro 1.5 million as of
December 31, 2010 (Euro 1,0 million as of December 31, 2009), as well as other financial assets of the North America retail
division totaling Euro 8.7 million as of December 31, 2010 (Euro 17,2 million as of December 31, 2009).