LensCrafters 2010 Annual Report Download - page 122
Download and view the complete annual report
Please find page 122 of the 2010 LensCrafters annual report below. You can navigate through the pages in the report by either clicking on the pages listed below, or by using the keyword search tool below to find specific information within the annual report.-
 1
1 -
2
-
3
-
4
-
5
-
6
-
7
-
8
-
9
-
10
-
11
-
12
-
13
-
14
-
15
-
16
-
17
-
18
-
19
-
20
-
21
-
22
-
23
-
24
-
25
-
26
-
27
-
28
-
29
-
30
-
31
-
32
-
33
-
34
-
35
-
36
-
37
-
38
-
39
-
40
-
41
-
42
-
43
-
44
-
45
-
46
-
47
-
48
-
49
-
50
-
51
-
52
-
53
-
54
-
55
-
56
-
57
-
58
-
59
-
60
-
61
-
62
-
63
-
64
-
65
-
66
-
67
-
68
-
69
-
70
-
71
-
72
-
73
-
74
-
75
-
76
-
77
-
78
-
79
-
80
-
81
-
82
-
83
-
84
-
85
-
86
-
87
-
88
-
89
-
90
-
91
-
92
-
93
-
94
-
95
-
96
-
97
-
98
-
99
-
100
-
101
-
102
-
103
-
104
-
105
-
106
-
107
-
108
-
109
-
110
-
111
-
 112
112 -
 113
113 -
 114
114 -
 115
115 -
 116
116 -
 117
117 -
 118
118 -
 119
119 -
 120
120 -
 121
121 -
 122
122 -
 123
123 -
 124
124 -
 125
125 -
 126
126 -
 127
127 -
 128
128 -
 129
129 -
 130
130 -
 131
131 -
 132
132 -
133
-
134
-
135
-
136
-
137
-
138
-
139
-
140
-
141
-
142
-
143
-
144
-
145
-
146
-
147
-
148
-
149
-
150
-
151
-
152
-
153
-
154
-
155
-
156
-
157
-
158
-
159
-
160
-
161
-
162
-
163
-
164
-
165
-
166
-
167
-
168
-
169
-
170
-
171
-
172
-
173
-
174
-
175
-
176
-
177
-
178
-
179
-
180
-
181
-
182
-
183
-
184
-
185
-
186
-
187
-
188
-
189
-
190
-
191
-
192
-
193
-
194
-
195
-
196
-
197
-
198
-
199
-
200
-
201
-
202
-
203
-
204
-
205
-
206
-
207
-
208
 |
 |

ANNUAL REPORT 2010> 120 |
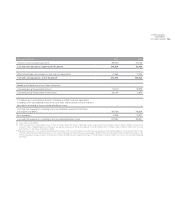
CONSOLIDATED STATEMENTS OF CASH FLOWS FOR THE YEARS ENDED DECEMBER 31, 2010 AND 2009 (*)
(thousands of Euro) 2010 2009
Net income 407,259 304,897
Stock–based compensation 32,940 24,936
Depreciation and amortization 322,062 285,445
Net loss on disposals of fixed assets and other 4,990 11,231
Other non–cash items (**) 4,524 13,806
Changes in accounts receivable (1,606) 25,659
Changes in inventories (36,544) 46,703
Changes in accounts payable 86,667 27,488
Changes in other assets/liabilities (21,114) 180,004
Changes in income taxes payable 32,455 (16,681)
Total adjustments 424,374 598,591
Cash provided by operating activities 831,633 903,488
Property, plant and equipment:
– Additions (230,358) (200,409)
– Disposals – –
Purchases of businesses – net of cash acquired (***) (121,761) (7,518)
Sales of businesses – net of cash disposed 5,520 –
Investments in equity investees (20,684) (21,323)
Additions to intangible assets – (19)
Cash used in investing activities (367,283) (229,269)
Long–term debt:
– Proceeds 881,705 987,738
– Repayments (930,362) (1,214,976)
Increase (decrease) in short–term lines of credit 14,185 (57,418)
Exercise of stock options 22,416 11,498
Sale of treasury shares 14,195 3,169
Dividends (169,839) (103,484)
Cash used in financing activities (167,700) (373,473)
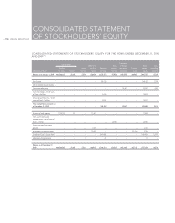
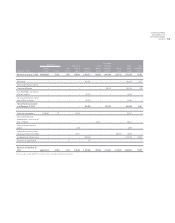
CONSOLIDATED STATEMENT
OF CASH FLOWS