Kroger 2013 Annual Report Download - page 91
Download and view the complete annual report
Please find page 91 of the 2013 Kroger annual report below. You can navigate through the pages in the report by either clicking on the pages listed below, or by using the keyword search tool below to find specific information within the annual report.-
 1
1 -
2
-
3
-
4
-
5
-
6
-
7
-
8
-
9
-
10
-
11
-
12
-
13
-
14
-
15
-
16
-
17
-
18
-
19
-
20
-
21
-
22
-
23
-
24
-
25
-
26
-
27
-
28
-
29
-
30
-
31
-
32
-
33
-
34
-
35
-
36
-
37
-
38
-
39
-
40
-
41
-
42
-
43
-
44
-
45
-
46
-
47
-
48
-
49
-
50
-
51
-
52
-
53
-
54
-
55
-
56
-
57
-
58
-
59
-
60
-
61
-
62
-
63
-
64
-
65
-
66
-
67
-
68
-
69
-
70
-
71
-
72
-
73
-
74
-
75
-
76
-
77
-
78
-
79
-
80
-
 81
81 -
 82
82 -
 83
83 -
 84
84 -
 85
85 -
 86
86 -
 87
87 -
 88
88 -
 89
89 -
 90
90 -
 91
91 -
 92
92 -
 93
93 -
 94
94 -
 95
95 -
 96
96 -
 97
97 -
 98
98 -
 99
99 -
 100
100 -
 101
101 -
102
-
103
-
104
-
105
-
106
-
107
-
108
-
109
-
110
-
111
-
112
-
113
-
114
-
115
-
116
-
117
-
118
-
119
-
120
-
121
-
122
-
123
-
124
-
125
-
126
-
127
-
128
-
129
-
130
-
131
-
132
-
133
-
134
-
135
-
136
-
137
-
138
-
139
-
140
-
141
-
142
-
143
-
144
-
145
-
146
-
147
-
148
-
149
-
150
-
151
-
152
 |
 |
A-18
The factors that most significantly affect the impairment calculation are our estimates of future cash
flows. Our cash flow projections look several years into the future and include assumptions on variables such
as inflation, the economy and market competition. Application of alternative assumptions and definitions, such
as reviewing long-lived assets for impairment at a different level, could produce significantly different results.
Goodwill
Our goodwill totaled $2.1 billion as of February 1, 2014. We review goodwill for impairment in the
fourth quarter of each year, and also upon the occurrence of triggering events. We perform reviews of each
of our operating divisions and variable interest entities (collectively, our reporting units) that have goodwill
balances. Fair value is determined using a multiple of earnings, or discounted projected future cash flows,
and we compare fair value to the carrying value of a reporting unit for purposes of identifying potential
impairment. We base projected future cash flows on management’s knowledge of the current operating
environment and expectations for the future. If we identify potential for impairment, we measure the fair
value of a reporting unit against the fair value of its underlying assets and liabilities, excluding goodwill, to
estimate an implied fair value of the division’s goodwill. We recognize goodwill impairment for any excess of
the carrying value of the division’s goodwill over the implied fair value.
In 2013, goodwill increased $901 million due to our merger with Harris Teeter which closed on
January 28, 2014. For additional information related to the allocation of the Harris Teeter purchase price, refer
to Note 2 to the Consolidated Financial Statements.
The annual evaluation of goodwill performed for our other reporting units during the fourth quarter
of 2013, 2012 and 2011 did not result in impairment. Based on current and future expected cash flows, we
believe goodwill impairments are not reasonably likely. A 10% reduction in fair value of our reporting units
would not indicate a potential for impairment of our goodwill balance.
For additional information relating to our results of the goodwill impairment reviews performed during
2013, 2012 and 2011 see Note 3 to the Consolidated Financial Statements.
The impairment review requires the extensive use of management judgment and financial estimates.
Application of alternative estimates and assumptions, such as reviewing goodwill for impairment at a different
level, could produce significantly different results. The cash flow projections embedded in our goodwill
impairment reviews can be affected by several factors such as inflation, business valuations in the market, the
economy and market competition.
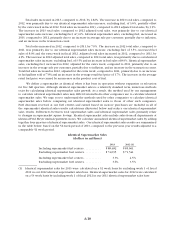
Store Closing Costs
We provide for closed store liabilities on the basis of the present value of the estimated remaining non-
cancellable lease payments after the closing date, net of estimated subtenant income. We estimate the net lease
liabilities using a discount rate to calculate the present value of the remaining net rent payments on closed
stores. We usually pay closed store lease liabilities over the lease terms associated with the closed stores,
which generally have remaining terms ranging from one to 20 years. Adjustments to closed store liabilities
primarily relate to changes in subtenant income and actual exit costs differing from original estimates. We
make adjustments for changes in estimates in the period in which the change becomes known. We review store
closing liabilities quarterly to ensure that any accrued amount that is not a sufficient estimate of future costs,
or that no longer is needed for its originally intended purpose, is adjusted to earnings in the proper period.
We estimate subtenant income, future cash flows and asset recovery values based on our experience and
knowledge of the market in which the closed store is located, our previous efforts to dispose of similar assets
and current economic conditions. The ultimate cost of the disposition of the leases and the related assets is
affected by current real estate markets, inflation rates and general economic conditions.
We reduce owned stores held for disposal to their estimated net realizable value. We account for costs to
reduce the carrying values of property, equipment and leasehold improvements in accordance with our policy
on impairment of long-lived assets. We classify inventory write-downs in connection with store closings, if
any, in “Merchandise costs.” We expense costs to transfer inventory and equipment from closed stores as they
are incurred.