Kroger 2013 Annual Report Download - page 85
Download and view the complete annual report
Please find page 85 of the 2013 Kroger annual report below. You can navigate through the pages in the report by either clicking on the pages listed below, or by using the keyword search tool below to find specific information within the annual report.-
 1
1 -
2
-
3
-
4
-
5
-
6
-
7
-
8
-
9
-
10
-
11
-
12
-
13
-
14
-
15
-
16
-
17
-
18
-
19
-
20
-
21
-
22
-
23
-
24
-
25
-
26
-
27
-
28
-
29
-
30
-
31
-
32
-
33
-
34
-
35
-
36
-
37
-
38
-
39
-
40
-
41
-
42
-
43
-
44
-
45
-
46
-
47
-
48
-
49
-
50
-
51
-
52
-
53
-
54
-
55
-
56
-
57
-
58
-
59
-
60
-
61
-
62
-
63
-
64
-
65
-
66
-
67
-
68
-
69
-
70
-
71
-
72
-
73
-
74
-
 75
75 -
 76
76 -
 77
77 -
 78
78 -
 79
79 -
 80
80 -
 81
81 -
 82
82 -
 83
83 -
 84
84 -
 85
85 -
 86
86 -
 87
87 -
 88
88 -
 89
89 -
 90
90 -
 91
91 -
 92
92 -
 93
93 -
 94
94 -
 95
95 -
96
-
97
-
98
-
99
-
100
-
101
-
102
-
103
-
104
-
105
-
106
-
107
-
108
-
109
-
110
-
111
-
112
-
113
-
114
-
115
-
116
-
117
-
118
-
119
-
120
-
121
-
122
-
123
-
124
-
125
-
126
-
127
-
128
-
129
-
130
-
131
-
132
-
133
-
134
-
135
-
136
-
137
-
138
-
139
-
140
-
141
-
142
-
143
-
144
-
145
-
146
-
147
-
148
-
149
-
150
-
151
-
152
 |
 |
A-12
Operating, General and Administrative Expenses
Operating, general and administrative (“OG&A”) expenses consist primarily of employee-related costs
such as wages, health care benefits and retirement plan costs, utilities and credit card fees. Rent expense,
depreciation and amortization expense, and interest expense are not included in OG&A.
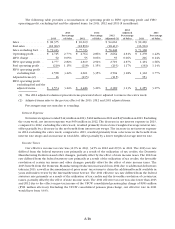
OG&A expenses, as a percentage of sales, were 15.45% in 2013, 15.37% in 2012 and 17.00% in 2011.
Excluding the 2013, 2012 and 2011 adjusted items, OG&A expenses, as a percentage of sales, were 15.43%
in 2013, 15.52% in 2012 and 15.94% in 2011. Our retail fuel operations reduce our overall OG&A rate, as a
percentage of sales, due to the very low OG&A rate on retail fuel sales as compared to non-fuel sales. OG&A
expenses, as a percentage of sales excluding fuel and the 2013 adjusted items, decreased 17 basis points in
2013, compared to 2012, adjusted for the 2012 adjusted items. This decrease resulted primarily from increased
identical supermarket sales growth, productivity improvements and effective cost controls at the store level,
offset partially by increased incentive compensation. OG&A expenses, as a percentage of sales excluding
fuel and the 2012 adjusted items, decreased 36 basis points in 2012, compared to 2011, adjusted for the
2011 adjusted items. This decrease resulted primarily from increased identical supermarket sales growth,
productivity improvements, effective cost controls at the store level, the benefit received in lower operating
expenses from the consolidation of four UFCW multi-employer pension plans in the prior year and decreased
incentive compensation, offset partially by increased healthcare costs.
Rent Expense
Rent expense was $613 million in 2013, as compared to $628 million in 2012 and $619 million in 2011.
Rent expense, as a percentage of sales, was 0.62% in 2013, as compared to 0.65% in 2012 and 0.69% in 2011.
Rent expense, as a percentage of sales excluding fuel, decreased four basis points in 2013, compared to 2012
and four basis points in 2012, compared to 2011. These continual decreases in rent expense, as a percentage
of sales both including and excluding fuel, reflects our continued emphasis on owning rather than leasing,
whenever possible, and the benefit of increased sales.
Depreciation and Amortization Expense
Depreciation and amortization expense was $1.7 billion in both 2013 and 2012 and $1.6 billion in 2011.
Depreciation and amortization expense, as a percentage of sales, was 1.73% in 2013, 1.71% in 2012 and 1.81%
in 2011. Excluding the extra week in 2012, depreciation and amortization expense, as a percentage of sales,
was 1.74% in 2012. Depreciation and amortization expense, as a percentage of sales excluding fuel and the
extra week in 2012, decreased three basis points in 2013, compared to 2012 and seven basis points in 2012,
compared to 2011. These continual decreases in depreciation and amortization expense, excluding the extra
week in 2012, as a percentage of sales both including and excluding fuel, are primarily the result of increasing
sales, offset partially by our increased spending in capital investments.
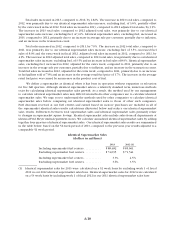
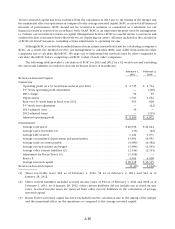
Operating Profit and FIFO Operating Profit
Operating profit was $2.7 billion in 2013, $2.8 billion in 2012 and $1.3 billion in 2011. Excluding the
extra week, operating profit was $2.7 billion in 2012. Operating profit, as a percentage of sales, was 2.77% in
2013, 2.86% in 2012 and 1.42% in 2011. Operating profit, as a percentage of sales excluding the extra week in
2012, was 2.81%. Operating profit, excluding the 2013, 2012 and 2011 adjusted items, was $2.7 billion in 2013,
$2.6 billion in 2012 and $2.2 billion in 2011. Operating profit, as a percentage of sales excluding the 2013,
2012 and 2011 adjusted items, was 2.79% in 2013, 2.69% in 2012 and 2.47% in 2011.
Operating profit, as a percentage of sales excluding the 2013 and 2012 adjusted items, increased 10 basis
points in 2013, compared to 2012, primarily due to improvements in operating, general and administrative
expenses, rent and depreciation, as a percentage of sales, offset partially by continued investments in lower
prices for our customers and increased shrink and advertising costs, as a percentage of sales. Operating
profit, as a percentage of sales excluding the 2012 and 2011 adjusted items, increased 22 basis points in 2012,
compared to 2011, primarily due to improvements in operating, general and administrative expenses, rent,
depreciation and the LIFO charge, as a percentage of sales, offset partially by continued investments in lower
prices for our customers and increased shrink and warehousing costs, as a percentage of sales.