Kroger 2013 Annual Report Download - page 80
Download and view the complete annual report
Please find page 80 of the 2013 Kroger annual report below. You can navigate through the pages in the report by either clicking on the pages listed below, or by using the keyword search tool below to find specific information within the annual report.-
 1
1 -
2
-
3
-
4
-
5
-
6
-
7
-
8
-
9
-
10
-
11
-
12
-
13
-
14
-
15
-
16
-
17
-
18
-
19
-
20
-
21
-
22
-
23
-
24
-
25
-
26
-
27
-
28
-
29
-
30
-
31
-
32
-
33
-
34
-
35
-
36
-
37
-
38
-
39
-
40
-
41
-
42
-
43
-
44
-
45
-
46
-
47
-
48
-
49
-
50
-
51
-
52
-
53
-
54
-
55
-
56
-
57
-
58
-
59
-
60
-
61
-
62
-
63
-
64
-
65
-
66
-
67
-
68
-
69
-
 70
70 -
 71
71 -
 72
72 -
 73
73 -
 74
74 -
 75
75 -
 76
76 -
 77
77 -
 78
78 -
 79
79 -
 80
80 -
 81
81 -
 82
82 -
 83
83 -
 84
84 -
 85
85 -
 86
86 -
 87
87 -
 88
88 -
 89
89 -
 90
90 -
91
-
92
-
93
-
94
-
95
-
96
-
97
-
98
-
99
-
100
-
101
-
102
-
103
-
104
-
105
-
106
-
107
-
108
-
109
-
110
-
111
-
112
-
113
-
114
-
115
-
116
-
117
-
118
-
119
-
120
-
121
-
122
-
123
-
124
-
125
-
126
-
127
-
128
-
129
-
130
-
131
-
132
-
133
-
134
-
135
-
136
-
137
-
138
-
139
-
140
-
141
-
142
-
143
-
144
-
145
-
146
-
147
-
148
-
149
-
150
-
151
-
152
 |
 |
A-7
MA N A G E M E N T ’S D I S C U S S I O N A N D A N A L Y S I S O F
FI N A N C I A L C O N D I T I O N A N D R E S U L T S O F O P E R A T I O N S
OU R B U S I N E S S
The Kroger Co. was founded in 1883 and incorporated in 1902. It is one of the nation’s largest retailers,
as measured by revenue, operating 2,640 supermarket and multi-department stores under two dozen banners
including Kroger, City Market, Dillons, Food 4 Less, Fred Meyer, Fry’s, Harris Teeter, Jay C, King Soopers, QFC,
Ralphs and Smith’s. Of these stores, 1,240 have fuel centers. We also operate 786 convenience stores, either
directly or through franchisees, and 320 fine jewelry stores.
Kroger operates 38 manufacturing plants, primarily bakeries and dairies, which supply approximately
40% of the corporate brand units sold in our retail outlets.
Our revenues are earned and cash is generated as consumer products are sold to customers in our
stores. We earn income predominately by selling products at price levels that produce revenues in excess of
the costs we incur to make these products available to our customers. Such costs include procurement and
distribution costs, facility occupancy and operational costs, and overhead expenses. Our retail operations,
which represent over 99% of Kroger’s consolidated sales and EBITDA, are our only reportable segment.
On January 28, 2014, we closed our merger with Harris Teeter Supermarkets, Inc. (“Harris Teeter”) by
purchasing 100% of the Harris Teeter outstanding common stock for approximately $2.4 billion. The merger
allows us to expand into the fast-growing southeastern and mid-Atlantic markets and into Washington, D.C.
Harris Teeter is included in our ending Consolidated Balance Sheet, but because of the timing of the merger
closing late in the year its results of operations were not material to our consolidated results of operations for
2013. See Note 2 to the Consolidated Financial Statements for more information related to our merger with
Harris Teeter.
OU R 2 0 1 3 P E R F O R M A N C E
We achieved outstanding results in 2013. Our business strategy continues to resonate with a full range
of customers and our results reflect the balance we seek to achieve across our business including positive
identical sales growth, increases in loyal household count, and good cost control, as well as growth in net
earnings and net earnings per diluted share. Our 2013 net earnings were $1.5 billion or $2.90 per diluted
share, compared to $1.5 billion, or $2.77 per diluted share for the same period of 2012. The net earnings for
2013 include a net benefit of $23 million, which includes benefits from certain tax items of $40 million, offset
partially by after-tax expense of $17 million ($7 million in interest and $10 million in operating, general and
administrative expenses) in costs related to our merger with Harris Teeter (“2013 adjusted items”). See Note 5
to the Consolidated Financial Statements for more information relating to the benefits from certain tax items.
For 2012, our net earnings include an estimated after-tax amount of $58 million or $0.11 per diluted share
due to a 53rd week in fiscal year 2012 (the “extra week”). In addition, 2012 net earnings benefited by $74
million after-tax or $0.14 per diluted share from a settlement with Visa and MasterCard and from a reduction
in our obligation to fund the UFCW consolidated pension fund created in January 2012. Excluding the 2013
adjusted items, net earnings for 2013 totaled $1.5 billion, or $2.85 per diluted share, compared to net earnings
in 2012 of $1.4 billion, or $2.52 per diluted share, excluding the Visa and MasterCard settlement, the UFCW
consolidated pension fund adjustment and the extra week in 2012. We believe adjusted net earnings and
adjusted net earnings per diluted share present a more accurate year-over-year comparison of our financial
results because the adjusted items were not directly related to our day-to-day business. After accounting for
these 2013 and 2012 adjusted items, our adjusted net earnings per diluted share for 2013 represents a 13%
increase, compared to 2012. Please refer to the “Net Earnings” section for more information.
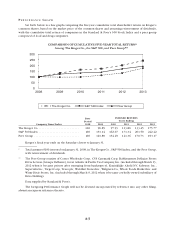
Our identical supermarket sales increased 3.6%, excluding fuel, in 2013, compared to 2012. We have
achieved 41 consecutive quarters of positive identical supermarket sales growth, excluding fuel. As we
continue to outpace many of our competitors on identical supermarket sales growth, we continue to gain
market share. We focus on identical supermarket sales growth, excluding fuel, as it is a key performance target
for our long-term growth strategy.