Kroger 2013 Annual Report Download - page 141
Download and view the complete annual report
Please find page 141 of the 2013 Kroger annual report below. You can navigate through the pages in the report by either clicking on the pages listed below, or by using the keyword search tool below to find specific information within the annual report.-
 1
1 -
2
-
3
-
4
-
5
-
6
-
7
-
8
-
9
-
10
-
11
-
12
-
13
-
14
-
15
-
16
-
17
-
18
-
19
-
20
-
21
-
22
-
23
-
24
-
25
-
26
-
27
-
28
-
29
-
30
-
31
-
32
-
33
-
34
-
35
-
36
-
37
-
38
-
39
-
40
-
41
-
42
-
43
-
44
-
45
-
46
-
47
-
48
-
49
-
50
-
51
-
52
-
53
-
54
-
55
-
56
-
57
-
58
-
59
-
60
-
61
-
62
-
63
-
64
-
65
-
66
-
67
-
68
-
69
-
70
-
71
-
72
-
73
-
74
-
75
-
76
-
77
-
78
-
79
-
80
-
81
-
82
-
83
-
84
-
85
-
86
-
87
-
88
-
89
-
90
-
91
-
92
-
93
-
94
-
95
-
96
-
97
-
98
-
99
-
100
-
101
-
102
-
103
-
104
-
105
-
106
-
107
-
108
-
109
-
110
-
111
-
112
-
113
-
114
-
115
-
116
-
117
-
118
-
119
-
120
-
121
-
122
-
123
-
124
-
125
-
126
-
127
-
128
-
129
-
130
-
 131
131 -
 132
132 -
 133
133 -
 134
134 -
 135
135 -
 136
136 -
 137
137 -
 138
138 -
 139
139 -
 140
140 -
 141
141 -
 142
142 -
 143
143 -
 144
144 -
 145
145 -
 146
146 -
 147
147 -
 148
148 -
 149
149 -
 150
150 -
 151
151 -
152
 |
 |

A-68
NO T E S T O C O N S O L I D A T E D F I N A N C I A L S T A T E M E N T S , CO N T I N U E D
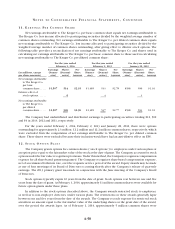
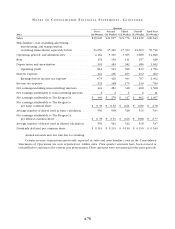
The following table sets forth by level, within the fair value hierarchy, the Plan’s assets at fair value as of
February 1, 2014 and February 2, 2013:
AS S E T S A T F A I R VA L U E A S O F F E B R U A R Y 1 , 2 0 14
Quoted Prices in
Active Markets
for Identical
Assets
(Level 1)
Significant
Other
Observable
Inputs
(Level 2)
Significant
Unobservable
Inputs
(Level 3) Total
Cash and cash equivalents ................... $ 26 $ — $ — $ 26
Corporate Stocks ........................... 326 — — 326
Corporate Bonds ........................... — 94 — 94
U.S. Government Securities .................. — 60 — 60
Mutual Funds/Collective Trusts ............... 303 419 39 761
Partnerships/Joint Ventures .................. — 317 — 317
Hedge Funds .............................. — — 1,073 1,073
Private Equity ............................. — — 243 243
Real Estate ................................ — — 96 96
Other .................................... — 139 — 139
Total. . . . . . . . . . . . . . . . . . . . . . . . . . . . . . . . . . . . . $655 $1,029 $1,451 $3,135
AS S E T S A T F A I R VA L U E A S O F F E B R U A R Y 2 , 2 0 1 3
Quoted Prices in
Active Markets
for Identical
Assets
(Level 1)
Significant
Other
Observable
Inputs
(Level 2)
Significant
Unobservable
Inputs
(Level 3) Total
Cash and cash equivalents ................... $ 17 $ — $ — $ 17
Corporate Stocks ........................... 375 — — 375
Corporate Bonds ........................... — 72 — 72
U.S. Government Securities .................. — 66 — 66
Mutual Funds/Collective Trusts ............... 130 559 — 689
Partnerships/Joint Ventures .................. — 378 — 378
Hedge Funds .............................. — — 739 739
Private Equity ............................. — — 180 180
Real Estate ................................ — — 91 91
Other .................................... — 139 — 139
Total. . . . . . . . . . . . . . . . . . . . . . . . . . . . . . . . . . . . . $522 $1,214 $1,010 $2,746