Kroger 2013 Annual Report Download - page 34
Download and view the complete annual report
Please find page 34 of the 2013 Kroger annual report below. You can navigate through the pages in the report by either clicking on the pages listed below, or by using the keyword search tool below to find specific information within the annual report.-
 1
1 -
2
-
3
-
4
-
5
-
6
-
7
-
8
-
9
-
10
-
11
-
12
-
13
-
14
-
15
-
16
-
17
-
18
-
19
-
20
-
21
-
22
-
23
-
 24
24 -
 25
25 -
 26
26 -
 27
27 -
 28
28 -
 29
29 -
 30
30 -
 31
31 -
 32
32 -
 33
33 -
 34
34 -
 35
35 -
 36
36 -
 37
37 -
 38
38 -
 39
39 -
 40
40 -
 41
41 -
 42
42 -
 43
43 -
 44
44 -
45
-
46
-
47
-
48
-
49
-
50
-
51
-
52
-
53
-
54
-
55
-
56
-
57
-
58
-
59
-
60
-
61
-
62
-
63
-
64
-
65
-
66
-
67
-
68
-
69
-
70
-
71
-
72
-
73
-
74
-
75
-
76
-
77
-
78
-
79
-
80
-
81
-
82
-
83
-
84
-
85
-
86
-
87
-
88
-
89
-
90
-
91
-
92
-
93
-
94
-
95
-
96
-
97
-
98
-
99
-
100
-
101
-
102
-
103
-
104
-
105
-
106
-
107
-
108
-
109
-
110
-
111
-
112
-
113
-
114
-
115
-
116
-
117
-
118
-
119
-
120
-
121
-
122
-
123
-
124
-
125
-
126
-
127
-
128
-
129
-
130
-
131
-
132
-
133
-
134
-
135
-
136
-
137
-
138
-
139
-
140
-
141
-
142
-
143
-
144
-
145
-
146
-
147
-
148
-
149
-
150
-
151
-
152
 |
 |

32
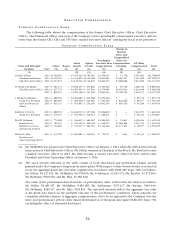
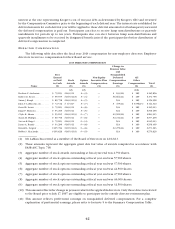
EX E C U T I V E C O M P E N S A T I O N
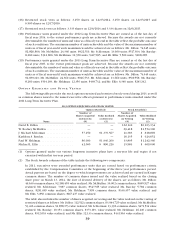
SU M M A R Y C O M P E N S A T I O N T A B L E
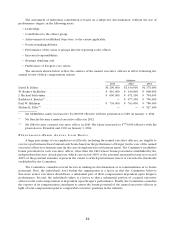
ThefollowingtableshowsthecompensationoftheformerChiefExecutiveOfficer, ChiefExecutive
Officer, Chief Financial Officer and each of the Company’s three most highly compensated executive officers
otherthantheformerCEO,CEOandCFO(the“namedexecutiveofficers”)duringthefiscalyearspresented:
SU M M A R Y C O M P E N S A T I O N T A B L E
Name and Principal
Position Year
Salary
($)
Bonus
($)
Stock
Awards
($)
Option
Awards
($)
Non-Equity
Incentive Plan
Compensation
($)
Change in
Pension
Value and
Nonqualified
Deferred
Compensation
Earnings
($)
All Other
Compensation
($)
Total
($)
(1) (2) (3) (4) (5) (6)
DavidB.Dillon 2013 $1,346,161 — $5,709,429 $2,781,910 $2,456,235 $15,376 $459,584 $12,768,695
Chairman and Former 2012 $1,328,320 — $3,332,852 $1,342,088 $1,600,065 $3,380,527 $301,985 $11,285,837
Chief Executive Officer 2011 $1,273,871 — $3,130,540 $1,716,693 $2,699,153 $3,088,686 $232,820 $12,141,763
W.RodneyMcMullen 2013 $ 962,731 — $5,062,435 $907,862 $1,722,946 $63,518 $166,329 $8,885,821
Chief Executive Officer 2012 $ 937,732 — $1,087,655 $437,983 $1,079,085 $1,415,003 $124,998 $ 5,082,456
2011 $ 899,113 — $1,009,368 $553,506 $1,821,903 $1,768,792 $104,573 $6,157,255
J.MichaelSchlotman 2013 $ 688,599 — $1,564,689 $509,088 $1,004,220 $ — $ 85,176 $3,851,772
SeniorVicePresident 2012 $ 669,787 — $ 609,908 $245,602 $602,146 $822,669 $60,137 $ 3,010,249
and Chief Financial 2011 $ 631,371 — $ 503,801 $276,269 $1,002,310 $ 990,524 $45,269 $3,449,544
Officer
KathleenS.Barclay 2013 $ 686,702 — $1,436,930 $307,838 $1,026,620 $ — $144,953 $3,603,043
SeniorVicePresident 2012 $ 675,972 — $ 491,998 $ 148,512 $628,271 $ — $ 96,054 $2,040,807
PaulW.Heldman 2013 $ 772,298 — $ 944,621 $460,267 $1,084,020 $ 11,645 $156,184 $3,429,035
Executive Vice 2012 $ 761,501 — $ 551,418 $ 222,048 $ 648,071 $1,266,466 $115,715 $3,565,219
President,Secretary 2011 $ 730,682 — $ 479,075 $262,710 $1,110,126 $1,374,309 $96,977 $4,053,879
andGeneralCounsel
MichaelL.Ellis 2013 $ 539,576 — $1,484,681 $236,283 $755,571 $ 1,944 $ 64,332 $3,082,387
President and
Chief Operating Officer
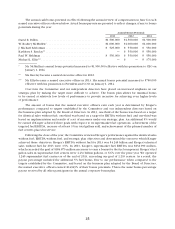
(1) Mr.McMullenwaspromotedtoChiefExecutiveOfficeronJanuary1,2014whenMr.Dillonretiredfrom
hispositionasChiefExecutiveOfficer.Mr.DillonremainsasChairmanoftheBoard.Ms.Barclaybecame
a named executive officer in 2012. Mr. Ellis became a named executive officer in 2013 and became
PresidentandChiefOperatingOfficeronJanuary1,2014.
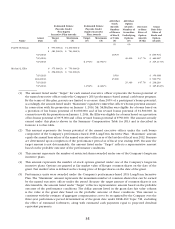
(2) The stock awards reflected in the table consist of both time-based and performance-based awards
grantedundertheCompany’slong-termincentiveplans.Withrespecttotime-basedawards,orrestricted
stock,theaggregategrantdatefairvaluecomputedinaccordancewithFASBASCTopic718isasfollows:
Mr.Dillon:$4,227,912;Mr.McMullen:$4,578,950;Mr.Schlotman:$1,293,572;Ms.Barclay:$1,272,990;
Mr.Heldman:$699,504;andMr.Ellis:$1,358,848.
Thevalueoftheperformance-basedawards,orperformanceunits,reflectedinthetableisasfollows:
Mr. Dillon: $1,481,517; Mr. McMullen: $483,485; Mr. Schlotman: $271,117; Ms. Barclay: $163,940;
Mr.Heldman:$245,117;andMr.Ellis:$125,833.Thereportedamountsreflecttheaggregatefairvalue
atthegrantdatebasedonthe probable outcomeoftheperformanceconditions.Theseamountsare
consistentwiththeestimateofaggregatecompensationcosttoberecognizedbytheCompanyoverthe
three-yearperformanceperiodoftheawarddeterminedasofthegrantdateunderFASBASCTopic718,
excluding the effect of estimated forfeitures.