Kroger 2013 Annual Report Download - page 84
Download and view the complete annual report
Please find page 84 of the 2013 Kroger annual report below. You can navigate through the pages in the report by either clicking on the pages listed below, or by using the keyword search tool below to find specific information within the annual report.-
 1
1 -
2
-
3
-
4
-
5
-
6
-
7
-
8
-
9
-
10
-
11
-
12
-
13
-
14
-
15
-
16
-
17
-
18
-
19
-
20
-
21
-
22
-
23
-
24
-
25
-
26
-
27
-
28
-
29
-
30
-
31
-
32
-
33
-
34
-
35
-
36
-
37
-
38
-
39
-
40
-
41
-
42
-
43
-
44
-
45
-
46
-
47
-
48
-
49
-
50
-
51
-
52
-
53
-
54
-
55
-
56
-
57
-
58
-
59
-
60
-
61
-
62
-
63
-
64
-
65
-
66
-
67
-
68
-
69
-
70
-
71
-
72
-
73
-
 74
74 -
 75
75 -
 76
76 -
 77
77 -
 78
78 -
 79
79 -
 80
80 -
 81
81 -
 82
82 -
 83
83 -
 84
84 -
 85
85 -
 86
86 -
 87
87 -
 88
88 -
 89
89 -
 90
90 -
 91
91 -
 92
92 -
 93
93 -
 94
94 -
95
-
96
-
97
-
98
-
99
-
100
-
101
-
102
-
103
-
104
-
105
-
106
-
107
-
108
-
109
-
110
-
111
-
112
-
113
-
114
-
115
-
116
-
117
-
118
-
119
-
120
-
121
-
122
-
123
-
124
-
125
-
126
-
127
-
128
-
129
-
130
-
131
-
132
-
133
-
134
-
135
-
136
-
137
-
138
-
139
-
140
-
141
-
142
-
143
-
144
-
145
-
146
-
147
-
148
-
149
-
150
-
151
-
152
 |
 |
A-11
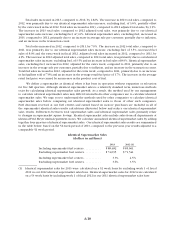
Gross Margin and FIFO Gross Margin
Our gross margin rates, as a percentage of sales, were 20.57% in 2013, 20.59% in 2012 and 20.92% in 2011.
The decrease in 2013, compared to 2012, resulted primarily from continued investments in lower prices for
our customers and increased shrink and advertising costs, as a percentage of sales, offset partially by a growth
rate in retail fuel sales that was lower than the total Company sales growth rate. Our retail fuel operations
lower our gross margin rate, as a percentage of sales, due to the very low gross margin on retail fuel sales as
compared to non-fuel sales. A lower growth rate in retail fuel sales, as compared to the growth rate for the
total Company, increases the gross margin rates, as a percentage of sales, when compared to the prior year.
The decrease in gross margin rates in 2012, compared to 2011, resulted primarily from a higher growth rate
in fuel sales, as compared to the growth rate for the total Company, continued investments in lower prices
for our customers and increased shrink and warehousing costs, as a percentage of sales, offset partially by a
decrease in the LIFO charge as a percentage of sales.
We calculate FIFO gross margin as sales minus merchandise costs, including advertising, warehousing,
and transportation expenses, but excluding the LIFO charge. Merchandise costs exclude depreciation and
rent expenses. Our LIFO charge was $52 million in 2013, $55 million in 2012 and $216 million in 2011.
FIFO gross margin is a non-GAAP financial measure and should not be considered as an alternative to gross
margin or any other GAAP measure of performance. FIFO gross margin should not be reviewed in isolation or
considered as a substitute for our financial results as reported in accordance with GAAP. FIFO gross margin
is an important measure used by management to evaluate merchandising and operational effectiveness.
Management believes FIFO gross margin is a useful metric to investors and analysts because it measures our
day-to-day merchandising and operational effectiveness.
Our FIFO gross margin rates, as a percentage of sales, were 20.62% in 2013, 20.65% in 2012 and 21.15%
in 2011. Our retail fuel operations lower our FIFO gross margin rate, as a percentage of sales, due to the very
low FIFO gross margin on retail fuel sales as compared to non-fuel sales. Excluding the effect of retail fuel
operations, our FIFO gross margin rate decreased 14 basis points in 2013, as a percentage of sales, compared to
2012. This decrease in 2013, compared to 2012, resulted primarily from continued investments in lower prices
for our customers and increased shrink and advertising costs as a percentage of sales. Excluding the effect of
retail fuel operations, our FIFO gross margin rate decreased 40 basis points in 2012, as a percentage of sales,
compared to 2011. This decrease in 2012, compared to 2011, resulted primarily from continued investments
in lower prices for our customers and increased shrink and warehousing costs as a percentage of sales.
LIFO Charge
The LIFO charge was $52 million in 2013, $55 million in 2012 and $216 million in 2011. We experienced
relatively consistent levels of product cost inflation in 2013, compared to 2012. In 2013, our LIFO charge
resulted primarily from an annualized product cost inflation related to meat, seafood and pharmacy. In 2012,
our LIFO charge resulted primarily from an annualized product cost inflation related to grocery, natural
foods, meat, deli and bakery, general merchandise and grocery, partially offset by deflation in seafood and
manufactured product. In 2012, we experienced lower levels of product cost inflation, compared to 2011. In
2011, our LIFO charge primarily resulted from an annualized product cost inflation related to grocery, meat
and seafood, deli and bakery, and pharmacy.