Kroger 2013 Annual Report Download - page 83
Download and view the complete annual report
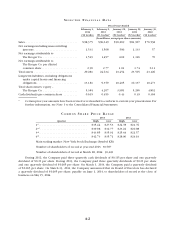
Please find page 83 of the 2013 Kroger annual report below. You can navigate through the pages in the report by either clicking on the pages listed below, or by using the keyword search tool below to find specific information within the annual report.-
 1
1 -
2
-
3
-
4
-
5
-
6
-
7
-
8
-
9
-
10
-
11
-
12
-
13
-
14
-
15
-
16
-
17
-
18
-
19
-
20
-
21
-
22
-
23
-
24
-
25
-
26
-
27
-
28
-
29
-
30
-
31
-
32
-
33
-
34
-
35
-
36
-
37
-
38
-
39
-
40
-
41
-
42
-
43
-
44
-
45
-
46
-
47
-
48
-
49
-
50
-
51
-
52
-
53
-
54
-
55
-
56
-
57
-
58
-
59
-
60
-
61
-
62
-
63
-
64
-
65
-
66
-
67
-
68
-
69
-
70
-
71
-
72
-
 73
73 -
 74
74 -
 75
75 -
 76
76 -
 77
77 -
 78
78 -
 79
79 -
 80
80 -
 81
81 -
 82
82 -
 83
83 -
 84
84 -
 85
85 -
 86
86 -
 87
87 -
 88
88 -
 89
89 -
 90
90 -
 91
91 -
 92
92 -
 93
93 -
94
-
95
-
96
-
97
-
98
-
99
-
100
-
101
-
102
-
103
-
104
-
105
-
106
-
107
-
108
-
109
-
110
-
111
-
112
-
113
-
114
-
115
-
116
-
117
-
118
-
119
-
120
-
121
-
122
-
123
-
124
-
125
-
126
-
127
-
128
-
129
-
130
-
131
-
132
-
133
-
134
-
135
-
136
-
137
-
138
-
139
-
140
-
141
-
142
-
143
-
144
-
145
-
146
-
147
-
148
-
149
-
150
-
151
-
152
 |
 |

A-10
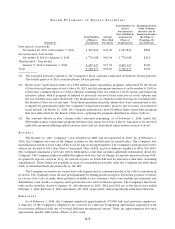
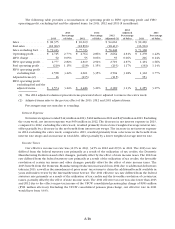
Total sales increased in 2013, compared to 2012, by 1.82%. The increase in 2013 total sales, compared to
2012, was primarily due to our identical supermarket sales increase, excluding fuel, of 3.6%, partially offset
by the extra week in fiscal 2012. Total sales increased in 2013, compared to 2012 adjusted total sales, by 3.9%.
The increase in 2013 total sales, compared to 2012 adjusted total sales, was primarily due to our identical
supermarket sales increase, excluding fuel, of 3.6%. Identical supermarket sales, excluding fuel, increased in
2013, compared to 2012, primarily due to an increase in average sale per customer, partially due to inflation,
and an increase in the transaction count.
Total sales increased in 2012, compared to 2011, by 7.0%. The increase in 2012 total sales, compared to
2011, was primarily due to our identical supermarket sales increase, excluding fuel, of 3.5%, increased fuel
sales of 8.9% and the extra week in fiscal 2012. Adjusted total sales increased in 2012, compared to 2011, by
4.9%. The increase in 2012 adjusted total sales, compared to 2011 total sales, was primarily due to our identical
supermarket sales increase, excluding fuel, of 3.5% and an increase in fuel sales of 8.9%. Identical supermarket
sales, excluding fuel, increased in 2012, adjusted for the extra week, compared to 2011, primarily due to an
increase in the average sale per customer, partially due to inflation, and an increase in the transaction count.
Total fuel sales increased in 2012, adjusted for the extra week, compared to 2011, primarily due to an increase
in fuel gallons sold of 7.8% and an increase in the average retail fuel price of 1.7%. The increase in the average
retail fuel price was caused by an increase in the product cost of fuel.
We define a supermarket as identical when it has been in operation without expansion or relocation
for five full quarters. Although identical supermarket sales is a relatively standard term, numerous methods
exist for calculating identical supermarket sales growth. As a result, the method used by our management
to calculate identical supermarket sales may differ from methods other companies use to calculate identical
supermarket sales. We urge you to understand the methods used by other companies to calculate identical
supermarket sales before comparing our identical supermarket sales to those of other such companies.
Fuel discounts received at our fuel centers and earned based on in-store purchases are included in all of
the supermarket identical sales results calculations illustrated below and reduce our identical supermarket
sales results. Differences between total supermarket sales and identical supermarket sales primarily relate
to changes in supermarket square footage. Identical supermarket sales include sales from all departments at
identical Fred Meyer multi-department stores. We calculate annualized identical supermarket sales by adding
together four quarters of identical supermarket sales. Our identical supermarket sales results are summarized
in the table below, based on the 52-week period of 2013, compared to the previous year results adjusted to a
comparable 52 week period.
Identical Supermarket Sales
(dollars in millions)
2013 2012 (1)
Including supermarket fuel centers . . . . . . . . . . . $ 88,482 $ 85,661
Excluding supermarket fuel centers . . . . . . . . . . . $ 74,095 $ 71,541
Including supermarket fuel centers . . . . . . . . . . . 3.3% 4.5%
Excluding supermarket fuel centers . . . . . . . . . . . 3.6% 3.5%
(1) Identical supermarket sales for 2013 were calculated on a 52 week basis by excluding week 1 of fiscal
2012 in our 2012 identical supermarket sales base. Identical supermarket sales for 2012 were calculated
on a 53 week basis by including week 1 of fiscal 2012 in our 2011 identical supermarket sales base.